


 English (pdf)
 Article in xml format
 Article references
 Send this article by e-mail
 Cited by SciELO
  Similars in
SciELO
Similars in
SciELO  uBio
uBio 
 Permalink
INTRODUCTION
Bolivia produces large amounts of royal quinoa, particularly in the Southern Highlands, where Royal quinoa grows with high contents of saponins, concentrated in the pericarp of the seed, these saponins have a bitter taste and must be eliminated before human consumption, but they also have various positive biological activities for humans. In the present work, we quantified the saponin content in grains of seven genotypes of royal quinoa from the southern highlands of Bolivia such as: white royal quinoa (QRB), yellow royal quinoa (QRA), Pandela royal quinoa (QRP), Toledo royal quinoa (QRT), Luki royal quinoa (QRL), black royal quinoa (QRN) and Pasankalla red royal quinoa (QRRP), through the implementation of Gas Chromatography coupled to mass spectrometry (GC/MS) methodology.
Quinoa crop is native to the high areas of the Andes on South America, where Bolivia is considered as center of origin and domestication for having the greatest genetic diversity1. Bolivia and Peru are the largest producers of quinoa in the worldwide(2). In Bolivia, quinoa is widely grown in the uninhabited lands of the Sierra Sur in adverse conditions, like its 3000 and 4000 meters above sea level, the low temperatures of up to -10ºC and a relatively low humidity of less than 40%3.In these adverse environmental conditions, plants generate a large number of secondary metabolites, including saponins,4 which are believed to be a plant defense mechanism. Saponins are characterized by having a bitter taste and have the ability to produce hemolysis in the blood, for that reason quinoa must go through a de-bittering process prior to consumption3, because the maximum acceptable level of saponin in quinoa for human consumption are between 0.06 and 0.12%5. On the other hand, some saponins are known to have a wide variety of biological properties, partially due to their amphiphilic structure6, they are active against numerous organisms such as bacteria and fungi7, in addition other relevant properties for humans have been reported such as: antiviral, anticancer, hypocholesterolemic, hypoglycemic, antithrombotic, diuretic and anti-inflammatory8),(9.
Quinoa contains mono- and bidesmosidic triterpene saponins, being thus, hydrophilic (oligosaccharide) and hydrophobic (aglycone), both parts linked by an ether bridge in C-3, and also, a glucose bound to the aglycone by an ester bond in C-2810. Previous studies identified the main aglycones of quinoa as Oleanolic acid, Serjanic acid, Hederagenin, and Phytolacagenic acid3),(4),(11. Several studies on the identification and quantification of saponins in Quinoa, include HPLC and GC/MS techniques, as well as semi-quantitative foam methods, ability to form complexes with the sterols of blood erythrocytes, hemolytic assay and, colorimetric methods such as Liebermann Burchard12. However, until now there is not universal method for saponin quantification, which can be due to the diversity of saponins present in quinoa. The medicinal and industrial interest for saponins in quinoa demands for more accurate and faster methods for their separation and quantification. In accordance with, the present investigation deals with the evaluation of the saponin content in seven genotypes of Bolivian royal quinoa variety through the implementation of gas chromatography coupled to mass spectrometry (GC/ MS) approach. This method allowed the determining of the high content of saponins in the forementioned varieties and to think about possible additional applications for such saponin contents13.
RESULTS AND DISCUSSION
The present investigation deals with the evaluation of the saponins content in seven genotypes of Bolivian royal quinoa variety from the Southern Highlands. White royal quinoa (QRB), Yellow royal quinoa (QRA), Pandela royal quinoa (QRP), Toledo royal quinoa (QRT), Luki royal quinoa (QRL), Black royal quinoa (QRN) and Pasankalla Red royal quinoa (QRRP), were characterized with respect to their saponins contents by gas chromatography coupled to mass spectrometry (GC/MS). Four major sapogenins, oleanolic acid, serjanic acid, hederagenin and phytolacagenic acid, obtained from the scarified residue (mojuelo) of Royal quinoa were employed as standards.
Obtaining of Standards
The isolation of the four quinoa sapogenins used as standards was carried out from the scarified residues of royal quinoa obtained from a quinoa processing company. The procedure started with the hydroalcoholic extraction of saponins from scarified residues of quinoa with an EtOH/H2O (1:1) mixture, followed by liquid-liquid separation with n-butanol, which allowed separation of saponins and phenolic compounds (n-butOH layer) from other more polar compounds like free sugars (aqueous layer). The saponin-rich butanolic extract was added of aqueous HCl (2N) giving rise to a hydroalcoholic mixture of sapogenins and sugars, due to the acid hydrolysis. After liq-liq separation and elimination of the organic layer solvent, the extract containing sapogenins was separated by chromatographic methods using open silica gel column. Individual components were identified by 1D and 2D NMR spectroscopy analysis and their structural proposals verified by comparison of NMR data with data from the literature4),(5),(11),(14.
Preparation of Sapogenin Extracts
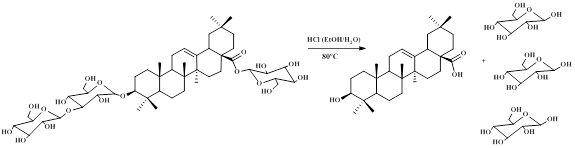
Extracts of the total content of sapogenins for each variety were obtained similarly as described above (cf. Obtaining of Standards until the obtention of the n-butanol extract). Each n-butanolic extract was separately subjected to molecular exclusion chromatography in Sephadex LH-20. This operation permits to separate sapogenins from phenolic compounds based on their difference in molecular weight. Figure 1 shows the products of acid hydrolysis of the saponin extract namely sapogenin plus sugars from acid hydrolytic excision at C-3 and C-28 of the bidesmosidic saponin.
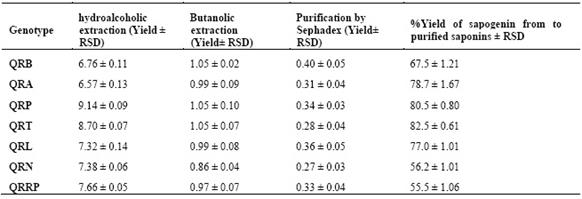
According of statistical analysis, the data corresponding to the hydroalcoholic and butanolic extractions, and the purification by molecular exclusion have a coefficient of variation of less than 4%, showing thus low dispersion of data, and good precision (Table 1). The yield of the sapogenin extract with respect to the purified saponin extract in each quinoa genotype is statistically similar to bibliographic references in quinoa10.
Sapogenin derivatization and GC/MS analysis
The derivatization of sapogenins was done by an equimolar silylation reaction with N,O-bis(trimethylsilyl)trifluoroacetamide, which consist in a SN2 substitution involving a nucleophilic attack on the silicon atom of the silyl donor group by the genine-3-OH and the genine-28-(C=O)-OH hydroxyl functions, producing the volatile trimethylsilylated triterpene, much less polar than the reactant, and the trifluoroacetamide15 (Figure 2).
The volatile trimethylsilyl derivatives of sapogenins were analyzed by GC/MS, a general chromatogram of the silylated ions was obtained, and from the analysis of signals in the chromatogram, the mass spectrum of the fragmented ions was obtained. This allowed the identification of each sapogenin in the sapogenin extract. Table 2 shows the principal fragments of trimethyl silylated sapogenins. In addition, the analysis of the mass spectrum allowed the establishment of the molecular formula of four sapogenins, based on their molecular ion M+, and on the previous studies16),(17.

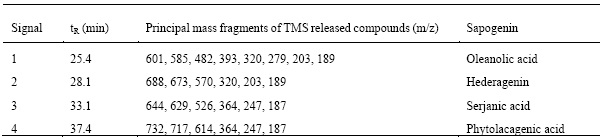
Oleanolic acid fragmentation ions are found in m/z 601 (molecular ion M+), m/z 585 (CH3 loss), m/z 482 (TMSiOOCH X2 loss), m/z 393 (TMSiOH and TMSiOOCH losses), and fragments of higher intensity at m/z 320, 279, 203 and 189 corresponding to the Retro Diels Alder (RDA) rearrangement (in the ring that possess a double bond) which evidence the existence of C-12 unsaturation. Another fragment with greater intensity at m/z 73 was also observed, which corresponds to the TMSi cation. All of these data are also in accordance with previous analyses reported16),(17.
Hederagenin fragmentation ions are found at m/z 688 (molecular ion M+), m/z 673 (CH3 loss), m/z 570 (TMSiOOCH loss), fragments of greater intensity at m/z 320 and 203 that correspond to the Retro Diels Alder (RDA) rearrangement, in the ring that has a double bond, confirming the unsaturation in C-12, in accordance with previous reports16),(17.
Similarly, serjanic acid fragmentation ions are found at m/z 644 (molecular ion M+), m/z 629 (CH3 loss), m/z 526 (TMSiOOCH loss) and fragments at m/z 364 and 247 corresponding to the Retro Diels Alder (RDA) rearrangement, in the C-12 carbon ring that has a double bond, evidencing the existence of this unsaturation16),(17.
Finally, the fragmentation ions of phytolacagenic acid were found at m/z 732 (molecular ion M+), m/z 717 (CH3 loss), m/z 614 (TMSiOOCH loss), fragments m/z 364, 247 and 233 which corresponds to the Retro Diels Alder (RDA) rearrangement, in the ring of carbon C-12 that has a double bond, in addition to a high-intensity fragment at m/z 73 that corresponds to the TMSication 16),(17.
Quantification of sapogenins
For the quantification of sapogenins, the calibration curve of four sapogenin standards was constructed to determine the concentration of individual sapogenins in each quinoa genotype. The area data obtained in the respective standards have a linear behavior with respect to the sapogenin concentration, and the correlation coefficients (R) were ≥ 0.99. In addition, the accuracy of the GC/MS analysis was determined using the Relative Standard Deviation (RSD) from the data obtained in triplicate for each standard solution, which was less than 5%.
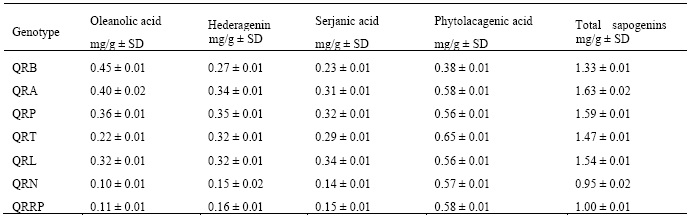
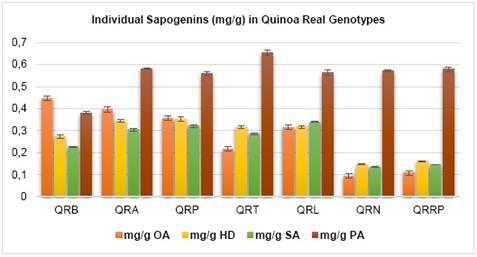
Based on the linear equations of the calibration curve of each sapogenin standard the concentration of individual sapogenin in quinoa of the seven genotypes was determined along with the content of sapogenin in mg/g of quinoa (Table 3). There, it can be observed that oleanolic acid and phytolacagenic acid are in higher concentration (Figure 3). In addition, considering that they are the major sapogenins, the approximate amount of total sapogenins in each genotype was obtained.
Both, the content of total sapogenins and the concentration of saponins are key indicators to be determined. We consider important to establish a conversion factor from total sapogenins to total saponins. According to previous studies related to quantification of saponins by gas chromatography, after the formation of trimethylsilyl derivatives from Oleanolic acid, a factor of conversion sapogenin to saponins were established by Peñafiel (% Saponins=8.5204 x %A.O.) (18 which was determined by the internal standard, based on a semi-purified extract of saponins, the factor obtained by Peñafiel could be analyzed since the extract of semi-purified saponins presents co-extractives such as pigments, flavonoids and phenolic compounds.
Therefore, in this investigation, in order to establish an approximate factor for the conversion of sapogenins to saponins, a purified extract of saponins (37.86 mg) was obtained by separation of co-extractives by fractionation with n-butanol followed by separation by molecular exclusion Sephadex LH-20, from 10.0 g of white quinoa. This saponin extract was subjected to acid hydrolysis and derivatization reaction of sapogenins prior to GC/MS analysis, considering the standard method of internal normalization, oleanolic acid is the major constituent with 48.3 % (4.47 mg oleanolic acid) respect to total sapogenins. From the standard method of internal normalization, the ratio was obtained to determine the conversion of oleanolic acid to total sapogenin; Oleanolic acid x 2,068 = Total sapogenins. Likewise, considering the weight of the purified saponins used, the approximate conversion factor of total sapogenins to saponins was established: % Saponins = 8.471 x % Sapogenins, which is not very different from the one previously determined by Peñafiel18. Finally, this conversion factor was used to determine the approximate total saponin content in the seven quinoa genotypes (Table 5).
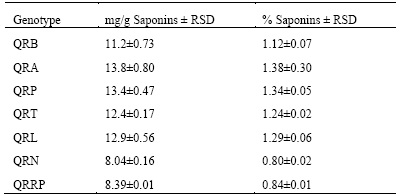
The approximate content of saponins in the genotypes of quinoa is between 0.8 and 1.4%, these results show high content of saponins in all the samples analyzed, this is because the samples were not subjected to any washing or scarification process and confirms that they are bitter quinoas, as expected when dealing with samples of royal quinoa from the Southern Highlands of Bolivia, known for their high saponin content. At the same time, we determined that the content of saponins in these samples is above the values accepted for human consumption according to Quality Standards (< 0.12% saponin).
Necessarily, before consuming them they must go through a debittering process that eliminates most of the saponins from the grains. However, knowing the high content of saponins in these samples opens the door to propose giving them added value, with a broad understanding of the biological and pharmacological activity of saponins8),(10),(20.
EXPERIMENTAL
MATERIALS AND METHODS
Plant material
Seven genotypes of royal quinoa (Chenopodium quinoa Willd) from the Southern Highlands of Bolivia were obtained from quinoa farmers in the Challapata market, in Oruro on November 14, 2020.
The quinoa seeds were ground into a fine powder and stored in polythene bags.
The sample of scarified residues (mojuelo) of royal quinoa has been obtained from the Irupana Andean Organic Food S.A., company. It was collected in August 2019.
Obtaining the extract rich in saponins
The hydroalcoholic extract of the Quinoa mojuelo was obtained according to the methodology described by Lozano (2011), in the Bio-organic Laboratory (LBO). A mixture of 4.5 L EtOH/H2O (1:1) was added to 500 g of Quinoa mojuelo, stirred at 450 rpm for 3 hours at room temperature. It was decanted and filtered, and the ethanol was removed by vacuum evaporation from the liquid phase in a rotary evaporator. The aqueous layer continued evaporation (60°C) under vacuum until dryness and the dried extract was freezed at -20°C.
Afterwards, 201.4 g of dry saponin extract were suspended in 250 mL of water and a liquid-liquid extraction was performed with n-butanol (3 timesx350 mL). The n-butanolic phases were concentrated and the product was dried in the oven at 45ºC.
Acid hydrolysis of saponins
For the hydrolysis, 500 mL of hydrochloric acid (2N, in 50% EtOH/H2O) were added to 20.51 g of n-butanolic extract, the mixture was set in an oil bath at 80 ºC, stirred at 350 rpm for 3 hours. The reaction was monitored by TLC-NP and TLC-RP-18 At the end of the reaction, non-polar sapogenins (aglycones) were observed as a white precipitate. The reaction mixture was cooled and neutralized with 4.0 N NaOH solution. The aqueous solution was extracted with AcOEt (3timesx250 mL), the fractions of AcOEt layers were dried in anhydrous Na2SO4, then it was filtered, concentrated and dried in the oven at 45ºC, obtaining an extract of sapogenins.
Isolation and identification of sapogenins
The isolation of sapogenins was done from the sapogenin extract by; Vacuum Liquid Chromatography (VLC), Flash Column Chromatography separation and Purification by Crystallization, obtaining four Sapogenins that were identified by Nuclear Magnetic Resonance Spectrometry (NMR) based on data from the 1H, 13C and two-dimensional spectra, obtained in the 300 MHz Bruker Nuclear Magnetic Resonance equipment of the Chemical Research Institute IIQ from Universidad Mayor de San Andrés.
Oleanolic acid
1H NMR (300 MHz, CDCl3) δ(ppm); 5.28 (1H, t, H-12), 3.23 (1H, t, H-3), 2.82(1H,dd, H-18), 1.97 (1H,m, H-16a), 1.81 (1H, m, H-11), 1.77 (2H, m, H-22), 1.61 (1H, m, 15a), 1.60 (2H, m, H-2a), 1.41 (1H, m, H-2b), 1.61 (1H, m, H-19a), 1,13 (1H, m, H-19b),1.49 (3H, m, H-15b, H-16b, H-9), 1.61 (3H, m, H-1a, H-7), 1.36 (2H, m, H-6b) 1.21 (3H, m, H-5, H-21), 1.13 (3H, s, H-27), 1,13 (2H, m, H-1b), 0.98 (3H, s, H-23), 0,77 (3H, s, H-24), 0.87(3H, s, H-25), 0.71 (3H, s, H-29), 0.74 (3H, d, H-26). RMN 13C (300 MHz, CDCl3) δ(ppm); 183.46(C-28), 143.61(C-13), 122.63(C-12), 77.09(C-3), 55.21(C-5), 47.63(C-9), 46.50(C-17), 45.88(C-19), 41.59(C-14), 40,96(C-18), 38.40(C-8), 38.39(C-4), 37.09(C-1), 33.7(C-10), 33.80(C-21), 32.60(C-29), 32.45(C-7), 30.68(C-22), 29.70(C-20), 27.69(C-23), 27.17(C-15), 26.0(C-2), 25.94(C-27), 22.91(C-11), 23.58(C-30), 23.39(C-16), 18.42(C-6), 17.15(C-26), 15.54(C-24), 15.32(C-25).
Serjanic acid
1H NMR (300 MHz, CDCl3) δ(ppm); 5.34 (1 H, t, H-12), 1.15 (2H, s, H-23), 3.23 (1 H, dd, H-3), 2.69 (1H, dd, H-18), 1.87 (1H, m,H-16), 1.88 (1H, m,H-11), 1.67 (2H, m, H-22), 1.76 (2H, m,H-7),1.59 (2H, m,H-2), 1.61 (1H, m, H-1a), 0.95 (1H, m, H-1b), 1.64 (1H, m,H-15) 1.60 (1H, m,H-19a), 2.0(1H, m,H-19b), 1.56 (1H, m,H-6a), 1.37 (1H, m, H-6b), 1.34 (1H, m,H-21a), 1.2 (1H, m,H-21b),1.1.14 (3H, s,H-29), 1.13 (3H, dd,H-27), 1,12 (3H,s, H-29) 1.54 (1H, m,H-9), 0.91 (3H, s, H-25), 0.76 (3H, s, H-24) 0.73 (1H, m, H-5), 0.72 (3H, s, H-26). RMN 13C (300 MHz, CDCl3) δ(ppm); 182.65(C-28), 176,99(C-30), 142.94(C-13), 123.39(C-12), 79.04(C-3), 55.22(C-5), 51.83(C-31), 47.63(C-9), 47,62(C-17), 43.72(C-20), 42.28(C-18), 42.27(C-14), 42.05(C-19), 39.25(C-8), 38.76(C-4), 38.40(C-1), 37.08(C-10), 33.53(C-22), 32.60(C-7), 30.33(C-21), 28.38(C-29), 28.10(C-23), 27.68(C-15), 27.18(C-2), 25.93(C-27), 23.36(C-16), 23.09(C-11), 18.28(C-6), 17.14(C-26), 15.54 (C-24), 15.34(C-25).
Hederagenin
1H NMR (300 MHz, CDCl3 +CD3OD) δ(ppm); 5.28 (1H, t, H-12), 3,70(2H, s, H-23), 3.16 (1H, d, H-3), 3.07 ( 1H, dd, H-18), 1.91 (1H, t, H-16a), 1.81 (2H, d, H-11), 1.65 (1H, m, H-15a), 1.61 (2H, m, H-22), 1.56 (1H, m, H-2a), 1.53 (1H, d, H-19a), 1.45 (5H, m, H-16b, H-9, H-1a, H-7, H-15b), 1,38 (2H, m, H-6), 1.14 (3H, m, H-5, H-21), 1.10 (3H, s, H-27), 0.99 (2H, m, H-19b, H-1b), 0.87 (9H, s, H-24, H-25, H-30), 0.77 (3H, s, H-29), 0.94 (3H, s, H-26). RMN 13C (300 MHz, CDCl3 +CD3OD) δ(ppm); 180.97(C-28), 143.78(C-13), 122.28(C-12), 71.97(C-3), 60,17(C-23), 49.03(C-5), 47.59(C-9), 46.36(C-17), 45.94(C-19), 41.70(C-4), 41.63(C-14), 41.12(C-18), 39.22(C-8), 38.07(C-1), 36.91(C-10), 33.84(C-21), 32.70(C-22), 32.47(C-29), 33.05(C-7), 30.66(C-20), 27.66(C-15), 26.63(C-2), 25.87(C-27), 23.55(C-11), 23.35(C-30), 22.99(C-16), 18.45(C-6), 16.92(C-26), 15.65(C-25), 11.35(C-24).
Phytolacagenic acid
1H NMR (300 MHz, DMSO) δ(ppm); 12.05 (s, 1H, COOH), 5.15 (1H, t, H-12), 3.60 (3H,s, H-31), 3.34 (2H, s, H-23a), 3.08 (1H, m, H-23b), 3.40 (1H, dd, H-3), 1.85 (1H, m, H-18), 1.95 (1H, H-16a), 1.98 (2H, d, H-11 ), 1.14 (1H, d, H-15a), 1.62 (2H, m, H-22), 1.57 (1H, m, H-2a), 1.54 (1H, m, H-19a), 1.38 (5H, m, H-16b, H-9, H-1a, H-15b), 1.26 (2H,m, H-6), 1.22 (3H, H-5, H-21), 1.11 (3H, s, H-27), 0.56 (3H, s, H-24), 1.00 (2H, m, H-19b, H-1b), 0.84 (3H, s, H-25), 0.70 (3H, s, H-29), 0.53 (3H,s, H-26). 13C NMR (300 MHz, DMSO) δ(ppm); 178.65(C-28), 176.81(C-30), 144.06(C-13), 122.42(C-12), 70.75(C-3), 64.91(C-23), 52.05(C-31), 47.56(C-5), 46.87(C-9), 45.39(C-17), 43.72(C-20), 42.65(C-18), 42.32(C-4), 42.11(C-19), 41.70(C-14), 39.24(C-8), 38.38(C-1), 36.76(C-10), 33.73(C-22), 32.46(C-7), 30.16(C-21), 27.01(C-15), 28.27(C-29), 27.74(C-2), 26.03(C-27), 23.19(C-11), 23.34(C-16), 17.95(C-6), 17.30(C-26), 15.96(C-25), 13.09(C-24).
Quantification of Sapogenins by GC/MS
GC/MS Instrumentation and Conditions
The separation was carried out using a GC-2010 plus Gas Chromatograph coupled to mass MS-QP-2020 SHIMADZU, with a DB-5ms Ultra Inert capillary column (5% phenyl, 95% dimethylpolysiloxane) From -60 to 325/350 ºC, the dimensions of the column are 30m x 0.25 mm inner diameter, 0.25 μm film, AOC-20i injector.
The injector and detector temperatures were both set to 300 °C, while the furnace temperature was programmed; initial at 100 °C (1 min), 20 °C/min at 280 °C (0.1 min), 5 °C/min at 300 °C (35 min), the injector temperature was set at 300 °C. The samples were injected in splitless mode, the injection volume was 1 μL. The splitless mode was used and the pressure of the carrier gas (helium) was 74.5 kPa, the column flow 0.67 mL/min. The ionization energy used was 70 eV.
Sapogenin extracts from different Quinoa genotypes
A hydroalcoholic extract was prepared from Quinoa seed according to the methodology described by Lozano et al., 2011. A mixture of 100 mL EtOH/H2O (1:1) was added to 10.0 g of quinoa seeds, stirred at 280 rpm for 3 h at room temperature. It was decanted and filtered, the ethanol was removed by rota-evaporation, and the aqueous extract was dried by lyophilization. A total of 0.7 g of the hydroalcoholic extract re-dissolved in water followed by liquid-liquid extraction with n-butanol (3 times x15 mL), The n-butanolic phases were concentrated by rota-evaporation and dried in the oven at 45ºC. 100 mg of the n-butanolic extract were purified by Molecular Exclusion Chromatography in the column of Sephadex LH-20, using ethanol as eluent, fractions of 15 mL were collected and controlled by TLC RP-18 plates using ACN/H2O as an eluent (1:1.8) and revelated with a 5% sulphuric acid solution to obtain a pure saponin fraction.
20 mg of purified saponin fraction was hydrolyzed by adding 20 mL of HCl 2.0 N in EtOH/H2O at 50 %, the mixture was set in an oil bath at 80 ºC, with stirring at 450 rpm for 3 h, the reaction was monitored by TLC chromatography. The reaction mixture was cooled and neutralized by adding 4.0 N NaOH and the sapogenins were then extracted by liquid-liquid separation with AcOEt (3 times x15 mL), the AcOEt fractions were dried with anhydrous Na2SO4 prior GC/MS analysis.
Derivatization reaction
Around 10 to 15 mg of sapogenin extract were subjected to derivatization reaction in inert atmosphere, 200 μL of pyridine anhydrous and 900 μL of BSTFA (N,O-bis(trimethylsilyl)trifluoroacetamide) were added, the reactions were stirred at 480 rpm, at room temperature for 2 h. Finally, the reaction product was rapidly cooled in ice bath, and 900 μL of hexane was added prior to GC/MS injection.
Preparation of Standards for Calibration Curves
Stock solutions (3.00-3.50 mg/mL) were prepared, for which 6.0-7.0 mg of the standard were subjected to derivatization reaction adding 200 μL of pyridine anhydrous and 900-1400 μL of BSTFA (N-O-bis-trimethylsisyl Trifluoro acetamide) in an inert atmosphere. The reaction was carried out at room temperature for 2 h, 2000 μL of the mixture were diluted with hexane. Subsequently, five standard solutions of different concentrations were prepared from the stock solution, microliters of these solutions were injected into the GC/MS equipment, the stock solution and standard solutions were prepared in triplicate. The calibration curves were constructed by linear regression, using the relationship of peak area versus concentration.
All the data obtained by integration of each signal of the standards in the chromatogram showed a linear behavior for the respective concentration, and the correlation coefficients (R) were ≥ to 0.99. The linear equations obtained for each standard were Oleanolic acid y= -7336429+23739003x, R=0.9993; Hederagenin y= -7676187+16766497x, R=0.9987; Serjanic acid y= -5614632 +12332552x, R=0.9996 and for Phytolacagenic acid y= -21127576+22699114x, R=0.9990. The values of the slopes of calibration curves allow the quantification of sapogenins using the least squares method.
Determination of the conversion factor from sapogenins to saponins
A hydroalcoholic extraction was carried out with 10.0 g of white Quinoa seeds, a mixture of 100 mL EtOH/H2O (1:1) was added and stirred for 3 h at room temperature. After that It was filtered, and the solvents were removed by rota-evaporation and lyophilization. 0.7 g of this extract was resuspended with n-butanol (3 times x15 mL), the n-butanolic phases were concentrated by rota-evaporation and dried at 45ºC. 100 mg of the n-butanolic extract was purified by fractionation in a column of Sephadex LH-20, using ethanol as eluent, fractions of 10 mL were collected and controlled by TLC RP-18 plates whit ACN/H2O (1:1.8) as eluent and revelated with 5% sulfuric acid solution. The purified saponin fractions from sephadex column were around 37.8 mg. 20 mg of the purified saponin fraction was subjected to acid hydrolysis reaction by adding 20 mL of HCl 2.0 N in 50% EtOH/H2O, the mixture of reaction was performed in oil bath at 80 ºC, with stirring for 3 hours, the progress of reaction was monitored by TLC-NF and TLC-RP-18 chromatography. The reaction product was cooled and neutralized with 4.0 N NaOH, sapogenins were then extracted by liquid-liquid separation with AcOEt (3 times x15 mL), the AcOEt fractions were dried with anhydrous Na2SO4. Finally, 10 mg of sapogenin extract was used to derivatize adding 200 μL of anhydrous pyridine and 900 μL of BSTFA (N-O-bis-trimethylsilyl Trifluoro acetamide) in inert atmosphere, and 900 μL hexane were added prior to GC/MS analysis.

Figure 4. GC/MS chromatogram of trimethylsilyl sapogenins derivatives Oleanolic acid at tR 25.4 min, Hederagenin at tR 28.1 min, Serjanic acid at tR3 33.1 min and Phytolacagenic acid at tR4 37.4 min.

