


 Inglés (pdf)
 Articulo en XML
 Referencias del artículo
 Enviar articulo por email
 Citado por SciELO
  Similares en
SciELO
Similares en
SciELO 
 Permalink
1. Introduction
Data as of December 2023, confirms that the US dollar remains the most used currency worldwide in value-based messages on SWIFT global payment system1, and central banks around the world continué to use it as the main store of value and anchoring reference for domestic currencies2.
Despite this, concerns have emerged due to its declining share as a reserve currency over the last 20 years and also due to some risks associated with the issuers solvency Meanwhile, emerging economies governments with contrary political views to the West, namely, The People's Republic of China, and The Russian Federation, are actively promoting alternative currencies, driven by political risks associated to financial sanctions (McDowell, 2023).
In a world where the use of the US dollar still predominates, policies to diminish its circulation may have limited success. Authoritarian governments and central banks can aim to reduce its use, but agents may find mechanisms to continue using it if the alternatives do not offer the same stability. Nevertheless, some flaws within the US economy and in its foreign policy could have some repercussions on the reserve currency diversification in development economies. This research aims to delve into these issues, discussing the implications of de- dollarization and diversification initiatives for developing economies.
The first section will summarize the current role of reserve currencies in the international monetary system. The second section will explain some ofthe main incentives for governments and agents to promote de-dollarization and diversification towards non-traditional reserve currencies, while also explain some macroeconomic and financial indicators that reflect recent flaws in the US economy and in its foreign policy, discussing some potential risks associated with the US dollar use.
The third section will start explaining some financial de-dollarization policies applied in development economies in order to promote the use of domestic currencies. Subsequently, exploring in more detail coordinated actions, like currency swap lines, commodities trade invoicing, and international payment systems. This section will also have a higher focus on the Chinese renminbi, as it represents the most likely short-term diversification option for economies susceptible to financial sanctions, as most of them rely on China as a trade and diplomatic partner. By estimating cross-sectional probit regressions, the empirical analysis will look first, to characterize common political preferences between influential blocs with the rest of the world, in order to spot “potential markets” that may b e willing to diversify towards non-traditional reserve currencies. Finally, characterizing some features of governments that are engaging into de-dollarization initiatives, such as authoritarian traits and common political preferences with the BRICS (Brazil, Russia, India, China, South Africa).
Summarizing, the empirical results show a clear link between governments' degree of authoritarianism and their intention to accept payments in alternative currencies. Governments expressing intentions to reduce the use of the US dollar for international payments display links with higher authoritarianism, common votes with BRICS countries in the United Nations General Assembly (UNGA), and a high trade proportion with China, while more democratic governments display a higher propensity to politically agree with the US and with the euro area. Countries anchoring their currencies to the euro demonstrate political closeness with the US and with the European Union, and those anchoring to the US dollar show a higher propensity to agree with BRICS countries and with China on political matters, showing that, as of the end of 2022, despite political differences with the US, these were still relying on the US dollar as their main currency reserve.
1.1. US Dollar Role as the Main Reserve Currency
According to the IMF COFER database, by the end of 2023, 58.36% of the total global foreign reserves held by central banks were denominated in US dollars. Next are the euro with 20.47%, the Japanese yen, with 5.51%, the English pound sterling with 4.95%, and the Chinese renminbi with 2.69%. The use as reserve currency of the euro and the renminbi increased modestly over the last years, and the share of US dollar reserves fell from around 70% since the start of 2000's.
The composition of foreign reserves reflects which currencies (and assets) are most demanded by central banks to back up the value oftheir own currencies, and to cover present and future obligations with the rest of the world (Gourinchas, 2019). While foreign reserves play a crucial role in backing the value of currencies, gold is still a reserve of value used by central banks, and some of them even increased their demand after the 2008 financial crisis (McDowell, 2023). However, financial instruments are easier to convert and more convenient than gold for financial transactions, and this is why central banks demand reserve currencies.
Iancu et al. (2022) summarizes four key elements to determine the reserve currency status:
1. Economic size of issuer country. The larger the economy and its role in international trade and financial markets, the more likely its currency will be used as a reserve asset.
2. Credibility of reserve issuers. Reserve assets should offer a stable store ofvalue over time, emphasizing the importance ofreserve issuers' financial markets depth and liquidity
3. Transactional demand. Central banks' reserve portfolio decisions are influenced by the uses of reserves, particularly for payments in trade and finance.
4. Inertia. It is hard for countries to make a quick transition to an alternative reserve currency There is a strong inertia in favor ofusing whichever currency has been the reserve currency in the past and by most countries.
According to the Atlantic Council's Dollar Dominance Monitor3, by the end of2023, the share of US dollar at export invoicing is 54%, and its share in foreign exchange transactions is 88% (over 200%). Meanwhile, the euro share represents 30% at export invoicing, and 31% in foreign exchange transactions, while the Chinese renminbi share at export invoicing is 4%, and its share in foreign exchange transactions is 7%.
Nevertheless, China stands out as the largest holder of foreign reserves in the world, with around 63% of their reserves being invoiced in US dollars at the end of 2021 (Arslanalp et al., 2022). One of the reasons why the Central Bank of China accumulates such high amount of US dollar reserves is to be able to “De facto peg” its exchange rate against the US dollar (Ilzetzki et al., 2019, to internationalize its currency In contrast, Eichengreen (2011) warns that maintaining such high level of US dollar reserves also creates a risk for China, because if the US bond market faces a crisis, this would also have negative consequences for the Chinese Central Bank, by pushing down the value of its dollar assets.
On the other hand, the first criterion mentioned by Iancu et al. (2022) for a currency to keep its reserve currency status is the size of the issuer economy. In terms of Purchasing Power Parity (PPP), Chinas GDP has outgrowth both, the euro area and the US, by representing around 18.92% ofthe world’s Real GDP, as the US shares 15.39% and India 7.47%4. In terms of nominal GDP at current prices, by 2024, the United States is still the largest economy, accounting for 25.48% ofglobal share, the second one being China, with 16.21% (IMF).
2. Drivers Behind Diversification and De-dollarization
2.1. Money Supply, US Debt, Interest Rates & Risk Qualification
Figure 1 shows some dynamics of recent inflationary pressures in the US. Neely (2023) highlights a correlation between the extraordinary increase of money supply (M2 growth) after the start of COVID-19 pandemic, and PCE (personal consumption expenditures) inflation, demonstrating that PCE inflation followed the peaks of higher US dollar supply. However, despite the significant emission increase due to the COVID-19 pandemic, his analysis suggests that there is still potential for PCE inflation to revert to levels consistent with the Federal Open Market Committee's 2% target.
Even with an extraordinary increase in money supply, the US dollar has exhibited resilience, as the demand for the currency was still matching the emission. However, this increase also translated into higher federal debt for the US. By the second quarter of2023, total public debt of the US was at 119.47% of GDP, and it is estimated that private debt amounts to approximately 217.80% of GDP until 2022 (OECD). According to Lubik (2021), a senior adviser at the Richmond Fed, the US debt limit sustainability is in part supported by the high levels ofseigniorage it can afford. The US can issue debt in its own currency, potentially paying down debt by issuing more dollars.
In August 2023, the risk rating agency Fitch & Ratings lowered the risk rating of the US to AA+ for the second time, fearing a default due to the size of its debt and higher interests' rates. Likewise, despite maintaining its AAA rating, the agency Moody’s changed its outlook to “negative”, pointing out the nation's worsening fiscal position and political polarization as long-term concerns5.
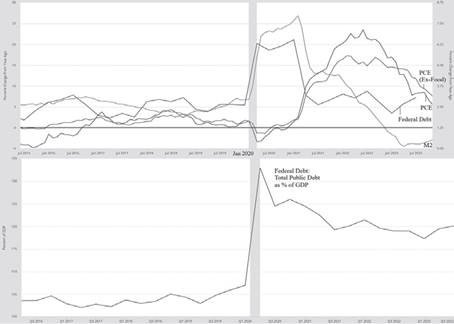
Source: St. Louis Fed.
Figure 1: US PCE Inflation (right axis), M2 supply growth (left axis), US Federal Debt growth rate (left axis) and US Federal Debt as GDP % (Below)
Graham & Tran (2024) argue that the higher borrowing costs in US dollars have encouraged emerging market firms to seek dollar alternatives, such as the Chinese renminbi, as depicted by Figure 2. According to the risk rating agencies, even if the Fed is expected to reduce interest rates, other factors will keep borrowing costs high, like another wave of Treasury bonds issuance, and governance risks related to the politicization ofpublic spending. The yield on the US 10-year Treasury also peaked to 4.85%, as of October 2023, closely approaching to 2007 rates at 5%.
2.2.US Foreign Policy & Sanctions
Currently, there is a growing concern over the US Foreign Policy and the use of financial sanctions. Following Nye (2023), anti-Americanism has surged in recent years. Soft power losses are linked to US foreign policy, with perceptions of the US as an imperialist power, and polls reveal negative attitudes toward American foreign policies in different countries, even in Europe, where the US is seen unfavorably in addressing global poverty, peacekeeping, and environmental issues.
McDowell (2023) argues that US foreign policy, particularly financial sanctions, can induce States relying on the US dollar to diminish its use. Sanctions restrict the use of US dollars in cross-border activities, freeze dollar-denominated assets, and diminish the US dollar's convenience. Thus, governments facing or fearing US sanctions may be encouraged to adopt anti-dollar policies to alleviate potential economic consequences.
The Office of Foreign Assets Control of the US Treasury (OFAC) administers different sanctions programs. The sanctions can be either (1) comprehensive or (2) targeted, using the blocking ofassets and trade restrictions to accomplish US foreign policy and national security goals. Sanctions are used as pressure measures promoted by the government against countries that violate the interests of the US. Governments that have mostly recorded human rights violations, and authoritarian traits, have been and are subject to sanctions by the US and by the EU (OFAC). Targeted sanctions are designed to cut sanctioned governments, individuals, or firms from the financial system. All financial institutions subject to US law are prohibited from facilitating cross-border transactions on behalfofsanctioned agents.
McDowell (2023) argues that, to some degree, US foreign policy influences governments' decisions on dollar use. Anti-dollar policies emerge in response to rising political risk or perceived costs. He claims that political differences also play a role in shaping governments' international currency policies. Complete de-dollarization is unlikely due to economic benefits, but such governments may be able to reduce their exposure to risks. The author defines “Political Risk” as “The potential for a political act to raise the expected costs of using a currency for cross-border transactions or as a store of value” The accumulation of these risks creates incentives for governments with authoritarian features to adopt anti-dollar policies, which promote the use of alternative currencies. In most cases, the trading partners of these countries are other developing economies as well. Then, if de-dollarization policies are successful, they can generate influence zones and use alternative currencies to trade with more countries. This is subject to the size of trading between partners and their economies' size, and it is worth emphasizing that, although there are intentions to use other currencies, these policies may not be successful.
According to the Office of Foreign Assets Control of the US Treasury, and Eichengreen (2022), sanctions against Russia for its invasion of Ukraine include disconnecting Russian banks from SWIFT; banning banks from engaging in transactions with Russian counterparties through the US Clearing House Inter-bank Payments System (CHIPS); and freezing the foreign reserves of Russias Central Bank. These measures were achievable because SWIFT, in which Western banks are important shareholders, is incorporated in Belgium and because CHIPS is supervised by the US government.
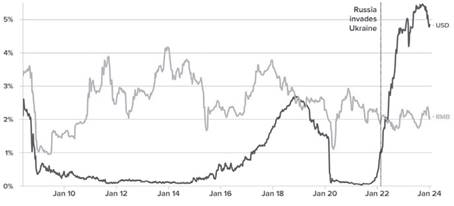
Figure 3 reflects how, after the imposed financial sanctions, Russia's trade using alternative currencies increased, in this case, using Chinese renminbi. On this regard, Figure 4 also shows the effects of the war on the increasing use of Chinese renminbi as a reserve currency worldwide. Graham & Tran (2024) state that currently, half of Chinas bilateral cross-border trade and investment transactions are settled in renminbi, reducing the countrys vulnerability to US financial sanctions.
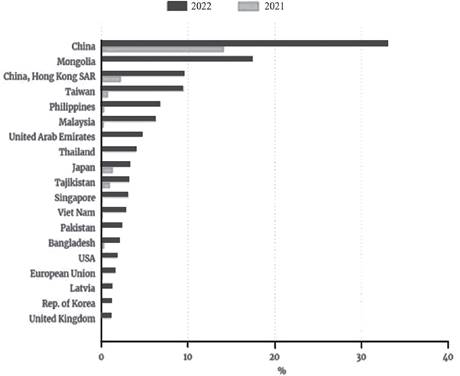
Note: Countries with at least 1 mln USD of imports invoiced in CNY in 2022.
Source: Extracted from Chupilkin et al. (2023).
Figure 3: Russian Federation trade invoiced in RMB, 2022
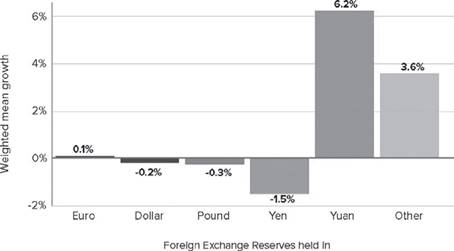
Source: Extracted from Norrlöf (2022).
Figure 4: Reserve Diversification After the Start of Russian War in Ukraine
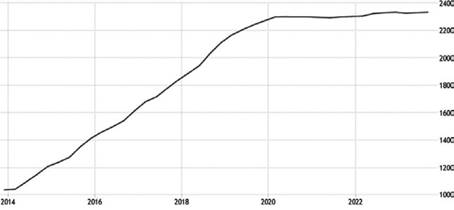
Even if Russia's invasión is a special historical event, for McDowell (2023), the political risk associated with sanctions does not only affect the use of the US dollar in targeted economies, but it also creates geopolitical risks in their surroundings. Ifauthoritarian regimes successfolly manage to reduce their dependence on the US dollar, it may be easier for them to intimidate neighboring nations. Complementary to this, Figure 5 displays a strong increase on the gold reserves in Russia prior to the invasion to Ukraine. Gold reserves in Russia reached an all-time high of 2333 Tonnes in the fourth quarter of 2022, demonstrating that, although the invasion of Ukraine was a surprising event for the West, and especially for Europe, the military action was already in a prior preparation phase.
Data from the World Gold Council reveals that central banks in countries with authoritarian traits or, with governments politically opposed to the West, also hold a relatively high proportion of gold as total reserves, such as Venezuela, Bolivia, Turkey, Kazakhstan, Belarus, Uzbekistan, Egypt, and Kyrgyzstan, among others. There are also some economies aligned with the G7 that maintain a relatively high proportion of gold reserves for hedging reasons, such as the US, Germany, France, Portugal, Italy, Austria, and Greece, among others6.
3. Diversification Efforts & Authoritarianism
3.1. Financial De-dollarization in Developing Economies
In some developing economies, which do not necessarily apply authoritarian traits, financial de-dollarization policies have been adopted by central banks to increase the appeal for domestic currencies. These are also important steps for their further internationalization, or, where appropriate, a diversification process towards the use of non-traditional reserve currencies. As explained previously, inertia is a key factor for evaluating the effectiveness of these measures, since it is more difficult to de-dollarize an economy in which US dollar use is more attractive than domestic instruments, and much more difficult if central banks do not achieve the stability expected by agents. In any case, financial de-dollarization policies can provide some important insights about the path to follow for successful diversification strategies.
There are some developing economies that do not use domestic currencies, and have adopted the US dollar or the euro, instead. Some of these are, for example: Ecuador and El Salvador, in Latin America, which have fully dollarized their financial systems, and Kosovo and Montenegro in East Europe, which use the euro instead ofa domestic currency. According to Levy-Yeyati (2021), cases like Ecuador dollarization resulted from a desperate attempt to put an end to a devastating currency crisis, which could probably have been resolved without recurring to such a drastic measure. With the current situation in Argentina, it is expected that the country may also adopt financial dollarization, mainly driven by the ideological position of the new president, Javier Milei.
According to Kubo (2017), financial de-dollarization measures involve diminishing the need for dollar instruments, with macroeconomic stabilization being crucial to mitigate inflation. Some suggested measures by the author include the development of alternative financial instruments, managing exchange rates, implementing prudential banking regulations, and non-market-based measures like restrictions on pricing goods in local currency.
Figure 6 displays some of the highest financial de-dollarization cases since 2000. Levy- Yeyati (2021) research focuses on financial dollarization and de-dollarization in Latin America, but also address African and Asian developing economies. The authors emphasize the need for policies based on the levels of financial dollarization, also highlighting that, overall, financial de-dollarization requires political and fiscal transparency.
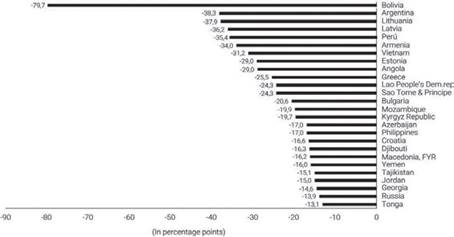
Source: Extracted from Levy-Yeyati (2021)
Figure 6: De-dollarization of Total Deposits (%) Since 2000 by Dollarized Country
Sosa & García (2011) analyze the drivers of financial de-dollarization in Latin America, focusing on Bolivia, Paraguay, Peru, and Uruguay These countries experienced a notable decline in financial dollarization over the 2000’s decade, attributed to factors such as exchange rate appreciation and the introduction of prudential measures. The authors emphasize the importance of maintaining strong macroeconomic fundamentals, including low and stable inflation. Addressing as well that, effective prudential regulation is crucial for promoting the use ofdomestic currencies, particularly in managing reserve requirements.
Although such policies are usefol to strengthen domestic currencies in their local use; these do not have the same impact on domestic currencies use for international trade, anchorage and foreign investment. Financial de-dollarization in developing economies can provide central banks effectiveness for achieving monetary policy objectives. However, these effects are also achieved largely because of an adequate level of currency reserves and reserve assets held by central banks, since agents still demand universally accepted reserve currencies to be able to make transactions with the rest ofthe world, and domestic currencies may be not so attractive for others. In this regard, the People's Republic of China managed to moderately expand the use ofits currency due to its large amount ofreserves and trade partners. Likewise, Russia achieved some resilience to the sanctions imposed by the West largely because of the accumulation ofgold reserves. The Federal Reserve also followed this logic during the Bretton Woods system, and when gold reserves were not enough, the value switched to the be backed by capital markets and global trade through commodities quotation, especially oil (Horii, 1986;Wagdi et al., 2023).
3.2. BRICS Potential & Influence
De-dollarization of payments between countries requires coordinated actions and the intention, not only ofgovernments, but most important, ofagents, to diversify their portfolios. In this section, we will discuss the role played by the BRICS countries on this matter. As explained previously, due to the inertia that exists towards the US dollar, the alternatives should meet the minimum stability requirements for their proposals to be taken seriously.
It is difficult to think about an immediate change in the reserve currency global structure, but a recurring topic on the multilateral meetings of the BRICS is to expand the use of their currencies. The governor of the Central Bank of South Africa commented on July 2023 that reducing dependence on the US dollar is a “political project”7, therefore, diplomacy seems to be a strategic path for the group to expand the use oftheir currencies. The internationalization strategy of BRICS currencies includes not only trade and economic growth, but also expanding their diplomatic influence over smaller economies and governments that are susceptible to sanctions (Liu & Papa, 2022;McDowell, 2023).
As it is a bloc that shares a big portion of global GDP and trade (IMF), it possesses not only economic size, but growing political influence as well. The world was largely influenced by the US after World War II, and countries adopted the rules and recommendations given by Bretton Woods institutions, namely the IMF and the World Bank (Eichengreen, 2011). Nevertheless, other countries followed alternative political paths, and, to this day, there are nations that do not share the same views as the US and its allies.
The BRICS accepted five new members recently: Saudi Arabia, Iran, Ethiopia, Egypt, and the United Arab Emirates. In current terms, the expanded bloc share of global GDP, represents around 27% ofglobal GDP (IMF), as it can be observed on Table 1. The last column of Table 1 also shows the countries' ranking (out of 167 positions) on The Economist Intelligence Unit Democracy Index8, an indicator that will be usefol to approximate and measure the governments degree of authoritarianism, as the research moves forward. How the index is measured is explained on detail on the next subsection. However, the table shows that, most ofthe members of the bloc share authoritarian traits as a common feature.
Table 1 Statistics for BRICS Countries, by Global Share, 2022
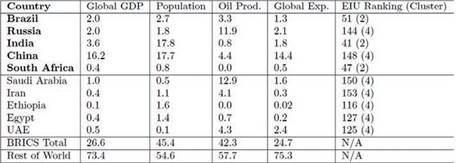
Source: IMF World Population Review, EI Statistical Review of World Energy, WTO, EIU.
The global oil market is still large, although some countries are trying to move away from fossil fuels (with limited success), and BRICS is set to play a much bigger role on it, as displayed by Table 1, due to the admission of Saudi Arabia, which alone accounts for 12.9% of global oil production. The BRICS' share of oil production will grow from 20.4% to 42.3% with the inclusion of the new members (Energy Institute Statistical Review of World Energy). Its expansion will also grow the group's share of global exports in goods to 24.7%, up from 20.2% (WTO). By conducting interviews to multiple stakeholders in Arab petroleum exporting countries, including central banks, governments, and international institutions, Wagdi, et al. (2023) claim that more than 50% ofthe interviewed anticipate a shift away from the petrodollar within three to five years. Saudi Arabia respondents lean towards success soon, especially with the rise of the Petroyuan and Petroruble. According to The Wall Street Journal9, during 2023, approximately 20% of global oil was bought and sold in other currencies, as Russia and Iran sold cargoes to China and other countries. Twelve major commodities contracts were announced in 2023 to be settled in alternative currencies, compared to seven in 2022. The UAE and India signed a deal to trade in their own currencies, starting with a shipment from UAE to an Indian refiner, paid in Indian rupees. Brazil and China completed their first local- currency commodity transaction, involving a shipment of Brazilian pulp, and Pakistan also started paying for Russian oil shipments in Chinese renminbi.
In any case, this is not the only bloc of countries that has assessed de-dollarization recently In an interview with The New Arab10, Dr. Omar Al-Ubaydli, President of the Bahrain Economists Society, expressed that, the Gulf Cooperation Council (GCC) States would answer to de-dollarization pragmatically, stating that they would be willing to accept payments in other currencies outside of the US dollar. The Association of Southeast Asian Nations (ASEAN), and the member countries of the Shanghai Cooperation Organization (SCO) have also agreed to increase the use of local currencies transactions11.
3.3. Authoritarianism in Developing Economies
At first glance, governments that are most likely to sympathize with the BRICS proposals correspond to developing economies. Therefore, before starting with the empirical analysis, some characteristics that these seem to share will be discussed.
According to the United Nations Development Programme (UNDP), a developing country is a country with a relatively low standard of living, and undeveloped industrial base, therefore, it has a moderate to low Human Development Index (HDI) score, which, summarizing, it is a comparative measure of poverty, literacy, education, and life expectancy. Developing countries and emerging markets are mostly small and medium-sized economies. However, currently sharing around 58.85% of Global GDP based on PPP (IMF). At the same time, these economies are key players on the global commodities supply chain.
Figure 7 shows the 2022 Democracy Index of The Economist Intelligence Unit. An indicator that will be usefal to approximate how countries are setting up their political regimes. The Index calculates a weighted average using 60 questions, mainly relying on expert assessments. Each country within The Economist Intelligence Unit's Democracy Index is classified into one of four clusters: (l) Full Democracies, (2) Flawed Democracies, (3) Democracies with Authoritarianism Traits or “Hybrid Regimes”, and (4) Authoritarian Regimes. The groups that are susceptible to sanctions and prone to agree with a multilateral order are the countries located in clusters 3 and 4. The report identifies countries with authoritarian traits as governments characterized by electoral fraud, pressure on political opposition, non-independent judiciaries, corruption, media control, and weak rule of law Authoritarian regimes lack political pluralism, featuring absolute monarchies or dictatorships, unfair elections (if held), state-controlled media, non-independent judiciary, and common censorship of government criticism (EIU, 2022).

According to the Democracy Index Report (EIU, 2022), authoritarian regimes may employ different means, including censorship, surveillance, flawed justice systems, and suppression of dissent to maintain control. Nowadays, authoritarian governance is shaped not only by the actions of governments, but also by non-state actors, such as drug cartels, private armies, insurgencies, and cyber attackers. According to the Democracy Index Report, many development economies have also refrained from aligning with the positions of the US, UK, and the EU in their stance against Russia. Currently, 93 of 167 countries are among governments with authoritarian traits or authoritarian governments, representing around 54.6% of the world’s population. Some ofthese countries are also vulnerable to sanctions.
Table 2 Correlation Table: Democracy Index and Human Development Index, 2022
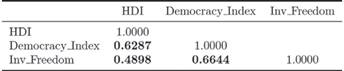
Source: Own elaboration with UNDP, The Economist Intelligence Unit & Heritage Foundation data.
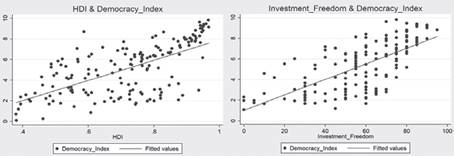
Source: Own elaboration with UNDP, The Economist Intelligence Unit & Heritage Foundation data.
Figure 8: Scatter Plot HDI, Democracy Index & Capital Controls, 2022
For a cross-section sample of 155 countries for 2022 data, the correlation matrix, displayed in Table 2 shows a positive and relatively high correlation between the degree of political freedom and the Human Development Index. The correlation coefficient of 0.63 means that democratic countries also show higher development indexes. At the same time, using the Capital Control Sub-Index from the Economic Freedom Index of the Heritage Foundation12, a positive relation between higher democracy levels and less capital controls can also be observed (0.66).
According to the Heritage Foundation's Index ofEconomic Freedom, capital controls refer to measures implemented by governments to restrict the free flow of capital across borders. These policies can be implemented to stabilize domestic financial markets and prevent currency depreciation during economic crises. However, authoritarian regimes can also use capital controls as a repressive tool (Pepinsky, 2007). There is still some debate about the relation between political and economic freedom, since there are countries that have separated them, such as Singapore, which is at the first position in The Heritage Foundation's Economic Freedom Index, while in The EIU Democracy Index is on position 69. Nevertheless, it is still a statistical relation that must be considered for the analysis.
The relation also shows that, in authoritarian regimes, incumbents can intervene in the decisions of central banks, increasing capital controls because of sanctions and restricting the circulation of traditional reserve currencies, even despite macroeconomic imbalances (Eichengreen, 2011;McDowell, 2023). Even enforced, ifthese measures are successful within a considerable size coalition, they can push domestic currencies and reduce their US dollar dependency (Ize & Yeyati, 2006;Sosa & Garcia, 2011), then they may be able to encourage other development economies which do not necessarily held authoritarian regimes to be willing to receive payments in alternative currencies and also use them as reserves, especially, if commodities like oil, are also quoted on such currencies. By this mean, policies and agreements, initially forced, could have an effect in the mid-long term, as it was discussed on previous subsections, leading later to market mechanisms, which currently are less likely to succeed against the strong inertia towards US dollar.
Another important characteristic of authoritarianism is that, although there is external economic pressure due to sanctions, or internal pressure due to popular discontent, governments can use repressive mechanisms and continue with de-dollarization and capital control measures, even if agents show resistance. It is also important to clarify that authoritarianism is a complex phenomenon and it is not enough to just change a president or a leader in a country to change structural characteristics that erode democracy, the rule of law, and central bank's independence. Even if authoritarians are removed from power, they are likely to sabotage democratic governments through pressure measures and come back by force (Burnell & Calvert, 1999). Under these considerations, it will be assumed that a certain inertia towards authoritarian traits prevails in these countries. As stated on the index report, authoritarianism not only refers to elections' transparency, but also to human rights, freedom of speech, and government powers independence.
3.4. Swap Lines and Chínese Renminbi Internationalization
McDowell (2023) defines swap lines as agreements between central banks to exchange one currency for another temporarily. These arrangements are established to provide liquidity and stabilize financial markets during times of economic stress.
Table 3 RMB Swap Lines
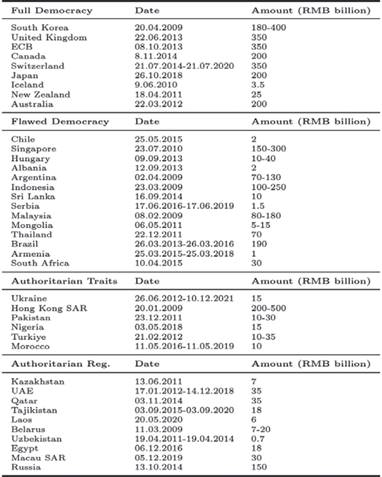
Note: As of end-2022; amounts in RMB billion. If end date is not specified, the line is ongoing)
Source: Chupilkin et al. (2023) and EIU).
Table 3 provides an overview of swap lines in renminbi across different regions. According to Yelery (2016) the operational effectiveness ofbilateral currency swap agreements is evident in China's strategy towards renminbi internationalization. In Latin America, Chinas bilateral currency swap agreements with countries like Chile, Brazil, and Argentina13 aim to promote it. These agreements also led to an increase of the Chinese renminbi share as of international reserves in Brazil and Chile, reaching by 2022, 8%14 and 5.37%15, respectively, from levels close to 0% in 2020 in Chiles case and currently sharing a higher proportion than euro in Brazil's case. In Europe, agreements with non-Euro countries and even with the European Central Bank signal efforts to diversify currency usage. Central Asia, serving as a vital link in China's Silk Road Economic Belt plan, witnesses bilateral currency swap facilitating renminbi proliferation and supporting trade expansion, as well as South Asia's Pakistan and Sri Lanka.
Source: Own elaboration with Chupilkin et al. (2023) & World Bank data.
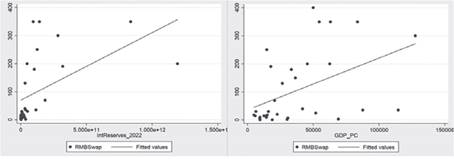
Figure 9: Scatter Plot RMB Swap Amounts, International Reserves & Current Prices Per Capita GDP, 2022
Figure 9 shows that the amounts negotiated on the swap lines are proportional to the amount of international reserves on current prices that central banks hold, and also proportional to the size of the economy on per capita terms. In some cases, developed economies also negotiate small amounts. Although there are some countries susceptible to sanctions or that are already sanctioned, the amounts ofthe swap lines are mainly linked to the amount of total reserves and to the size of economies.
Using panel data, McDowell (2023) estimates that governments that face sanctions show a statistically significant propensity to sign swap agreements. He estimates that, in some extent, the decision to enter into local currency swap agreements are linked to US sanctions pressure. However, he also argues that governments may also be motivated to sign currency agreements for reasons unrelated to financial sanctions, as settling trade in local currencies can reduce firms' exposure to the foreign exchange risk associated with using third-party currencies in trade. He also states that countries engage in currency swap lines if they are concerned about future financial and economic risks associated with the US economy
On this matter, Figure 10 helps to visualize the increase in the use ofthe Chinese renminbi, after Russia's invasion to Ukraine. As of November 2023, it has reached its largest participation in the SWIFT payment system. And considering data since 2018, it has more than doubled its use in international payments. However, SWIFT data shows that its main clearing center is still being Hong Kong, and most economies that have a higher value share of Chinese renminbi payments are developed economies, most ofthem being main trade destinations for Chinese exports (MIT Observatory ofEconomic Complexity).
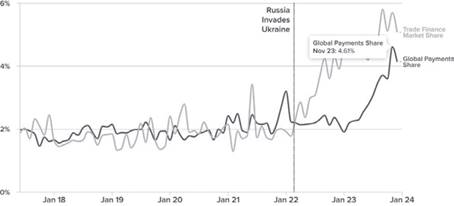
Source: Extracted from Graham & Tran (2024).
Figure 10: Evolution of RMB's share as a global payment's currency, by Dec. 2023
Another way the Peoples Bank ofChina (PBOC) aims to boost the use ofthe renminbi is by the Cross-Border Interbank Payments System (CIPS), established in 2015. All transactions and accounts are denominated in renminbi, and currently, there are 139 direct participants, primarily overseas branches of Chinese banks, and 1.345 indirect participants, with around 40% in China and 60% abroad16. Some notable participants according to these authors include the Bank of East Asia, DBS Bank, HSBC, Citi, and BNP Paribas. Jin (2022)) reports that transaction value increased by 75% in 2021 and transaction volume by 50%. According to CIPS' official website, by December 2023, the average amount of daily transactions has almost doubled compared to January 2023, from 382.9 bn RMB (54 bn USD) to 595.2 bn RMB (84 bn USD), and more banks around the world are set to join.
3.5. Empirical Analysis: Political Closeness & Intention
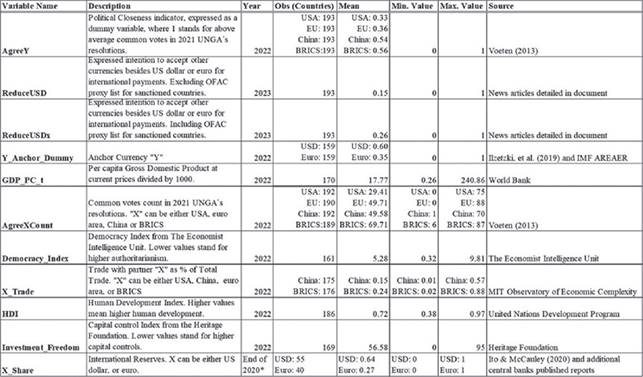
3.5.1. Data, Descriptive Statistics and Correlations
According to Voeten (2013), governments' foreign policy preferences are reflected on their votes in the United Nations General Assembly (UNGA). Voting at the UNGA addresses a wide range of issues, including international peace and security, economic development, human rights, international relations, environment, disarmament, and humanitarian aid. Member States discuss and deliberate looking for solutions and cooperation in different areas, thus, making it an ideal indicator to understand which governments are most likely to have common preferences on international policy matters, beyond territorial proximity Even if internationalization ofreserve currencies is not an explicit topic at the UNGA, it is still a great indicator for getting common policy preferences among issuers blocs, and, given the current global scenario, with armed conflicts, and political costs expected to increase, it can give some hints about potential markets for non-traditional reserve currencies.
Using the last available cross-sectional data (2022) from Voeten (2013) UNGA voting database, The Economist Intelligence Unit's Democracy Index, the Economic Freedom Index from Heritage Foundation, trade data from the MIT Observatory of Economic Complexity, and the reserve currency anchoring database of Ilzetzki et al., (2019), updated with IMF AREAER17 information (2022), the relation between the political preferences of governments, authoritarianism, reserve currencies, and trade, will be empirically analyzed.
Table 4 Descriptive Statistics from Govs. Willing to Accept Non- Traditional Reserve Currencies, 2022
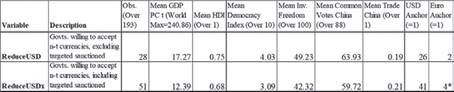
*Malaysia and Singapore anchor lo both euro and USD
Source: Own calculations.
Table 4 provides insights from some descriptive statistics for the two groups of countries willing to accept non-traditional currencies, with differences observed excluding and including targeted sanctioned countries. The variable “ReduceUSD” takes the value of 1 if they expressed their intention to accept payments in alternative currencies, and 0 if not, most of them being BRICS, ASEAN, SCO, and GCC members. This data was collected using the literature already cited in the document, and recent news as of December 2023. “ReduceUSD” stands for countries that are not listed by the Office of Foreign Assets Control for geographically oriented sanctions (OFAC, 2023), but have recently expressed interest on making international payments in alternative currencies, while “ReduceUSDx” include targeted sanctioned countries as well18. At first glance, non-sanctioned countries willing to promote the use of alternative currencies, display higher values in economic size, human development, democracy levels, and investment freedom. Again, it can be noticed that authoritarian traits are also linked to capital controls. Sanctioned countries also display a higher share with China as a trade partner, and it is worth mentioning that the mean in the Democracy Index has fallen for both groups since 2021, from 4.49 for non-sanctioned countries, and from 3.43 for sanctioned countries, to 4.03 and 3.09 respectively in 2022, pointing out increasing authoritarianism among them.
Table 5 Descriptive Statistics from Govs. that Share Common Preferences at UNGA, 2022

Source: Own calculations.
Table 5 shows the same descriptive comparison for groups that share common preferences at the UNGA. The political closeness variables were generated taking into account whether the number oftimes the representatives at the UNGA voted exactly the same as the reference countries. In case of having a number of common votes greater than the average, the Agree” variable takes the value of1 and in case they agree less than the average, it takes the value of 0. According to Voeten (2013) database, a total of88 resolutions were voted on during 2022, and 163 in 2021, which are the analysis periods due to the most recent availability ofdata. It can be observed that more countries show common political preferences with China and with the BRICS than with the US and with the euro area. These countries tend to show authoritarian traits, significantly lower levels of per capita GDP, higher capital controls, and lower HDI levels. Most of these also anchor their currencies to the US dollar, while representatives that show a higher propensity to agree with the US and the euro area countries anchor to the euro.
Complementary to this, Figure 11 shows correlations between common political preferences at the UNGA and the reserve currencies composition in some central banks, by country. The COFER IMF database is very limited on the composition of reserve currencies for each country, as not all ofthem publish this information, but Ito & McCauley (2020) built a database based on currency composition reports by central banks. Although it is the most complete and free data set to use, the sample is limited to 75 countries, with 7 additional Latin American countries, and 2021 being the last period available.
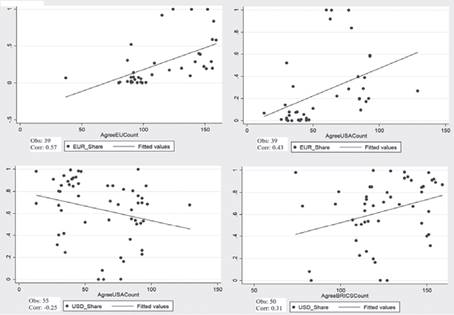
Source: Own elaboration with Ito & McCauley (2020) data.
Figure 11: Reserve Currency Share by Country and UN General Assembly Resolutions Votes, 2021
Again, countries holding a larger amount of euro reserves show a greater propensity towards common political preferences with the euro area (Corr.: 0.57). These countries do not only show a relatively high relation in common votes with the euro area countries, but also with the US (Corr.: 0.43). Countries that hold a higher proportion ofdollar reserves show a negative correlation of -0.25 with common votes with the US. This relation shows that, by 2021, despite political differences with the US, some developing economies still have the need to keep US dollar reserves. Countries that hold a higher proportion of dollar reserves also seem to show common political preferences with BRICS countries (Corr.: 0.31).

Source: Own elaboration with EIU & Voeten (2013) data.
Figure 12: Democracy Index and UN General Assembly Resolutions Votes, 2022
Using the EIU Democracy index, Figure 12 shows an initial relation between the common votes on the UNGA and the degree of authoritarianism. Democratic governments show common political preferences with the US and with the euro area, while countries with authoritarian traits show common political preferences with China and with BRICS countries.
Table 6 displays in greater detail the composition of clusters 3 and 4 of the Democracy index, categorized as governments with authoritarian traits and authoritarian regimes, respectively. Using the database of votes on resolutions in the United Nations General Assembly, a political closeness of 72% of the 33 States with respect to China in the cluster of governments with authoritarian features and a political closeness of 75% on the cluster of States with authoritarian regimes was estimated.
Table 6 EIU Democracy Index Cluster Comparison, 2022
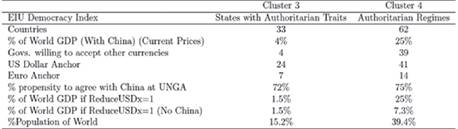
Source: Own calculations with IMF, The Economist Intelligence Unit, Voeten (2013) and World Bank data.
3.5.2. Methodology: Probit Regressions
Angrist and Pischke (2009) point out that a probit model is a statistical approach that is used to predict binary variables, such as “agree” or “disagree”, by using the fanction of standard normal cumulative distribution, with the purpose of understanding how the predictor variables influence the probability of observing one of the two possible results, allowing to estimate coefficients that represent the relative impact of the predictors on the probability of the result. This technique will be used to estimate the propensity for governments to agree on their preferences on common international policy matters and most important, on their propensity to particípate on de-dollarization initiatives.
The main consideration for using the latest available cross-sectional data is to take the “present” as an initial situation, assuming that the intention and commitment to do something will carry out implications for the future. The aim is to explain the mechanisms by which non- traditional reserve currencies can find potential markets, especially in an international context with greater polarization of political forces and an expected increase in armed conflicts. It is also important to clarify that, political closeness should be interpreted as governments' propensity to share common international policy preferences rather than a strict vertical political alignment, as each nation's vote in the UNGA holds equal weight.
Governments participation on currency diversification initiatives may be influenced by factors outside inertia, such as, trade relationships, geopolitical considerations, and risk minimizing options (Liu & Papa, 2022;McDowell, 2023). By identifying these patterns, the research aims to build models that effectively explain the propensity of governments looking for diversification options. The goal is to understand underlying conditions, beyond inertia, that drive governments to agree towards non-traditional reserve currencies use.
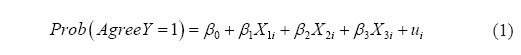
First, probit regressions will be estimated in order to approximate the relation between authoritarianism and the propensity to agree on common international policy matters (Equation (1)), where the variables explained will be the propensity to agree, measured by the votes in common that countries have with the issuers of reserve currencies at the UNGA, again, with the US, euro area countries, China, and BRICS. To compare the consistency ofthe political preferences, the models will be estimated for both 2021, and 2022 data.
Regressions 1-4 (2022) & Regressions 5-8 (2021):
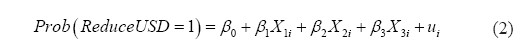
After these, probit models will be estimated with the dependent variable being the expressed intention of governments to promote non-traditional reserve currencies on international payments (Equation (2)), which takes the value of 1 if they expressed their intention to particípate in de-dollarization initiatives, and 0 if not. Regressions 9 to 11 are estimated with countries that are not listed by the Office of Foreign Assets Control for geographically oriented sanctions but have recently expressed interest on making international payments in alternative currencies, while regressions 12 to 14 include sanctioned countries as well (ReduceUSDx), to compare the coefficients. The explanatory variables are the EIU Democracy Index, the Heritage Foundation Capital Controls Index, the common votes at the UNGA with the BRICS group, and the proportion of trade with China. The models are estimated using different variable combinations to avoid collinearity. These estimations can also be compared with 2021 results, shown in the annex.
Regression 9 & 12 (ReduceUSDx):
Regression 10 & 13 (ReduceUSDx):
Regression 11 & 14 (ReduceUSDx):
On the same topic, this technique is used by McDowell (2023), estimating probit regressions, where the explained variables are the participation of at least one bank per country on the Cross-Border Interbank Payment System (CIPS) and participation on Chinese renminbi swap lines. In those models, the variable takes the value of 1 if the country has at least one Bank participating on the initiative, while 0 if not, and 1 if they got involved on swap agreements with the PRC and 0 if not. McDowell (2023) uses as explanatory variables the likelihood that non-sanctioned governments may face sanctions in the future and if countries already face sanctions, showing a positive relation between the participation of countries on the CIPS payment system and the exposure to sanctions, which are also linked to authoritarianism. As November 2023, the payment system has already expanded to 111 countries and although McDowell (2023) manages to show a relatively significant relation between the countries' participation on the payment system and their exposure to sanctions, CIPS has also grown, and it was adopted in many countries that do not necessarily face political risks.
3.5.3. Probit Regressions Results
Table 7 Probit Models UN General Assembly Votes, 2022
Note: *** stands for significant at 1%, ** at 5% and * at 10%.
Source: Own estimations with IMF, The Economist Intelligence Unit, Voeten (2013) data.
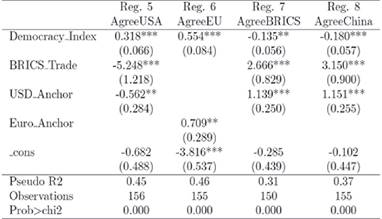
Tables 7 and 8 present the results of equation (l) models regarding governments' propensity to share common policy preferences for the years 2022 (Table 7) and 2021 (Table 8).
Table 8 Probit Models UN General Assembly Votes, 2021
Note: *** stands for significant at 1%, ** at 5% and * at 10%.
Source: Own estimations with IMF, The Economist Intelligence Unit, Voeten (2013) data.
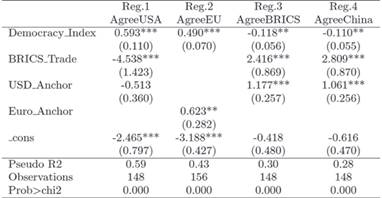
First, for both years, the probit regressions display a significant relationship between the degree of authoritarianism of governments ('Democracy_Index') and the probability to agree on common political preferences at the UNGA. The coefficients show that, there is a significantly higher probability that countries with higher scores on the index (democratic governments) share common policy preferences with the United States and the euro area, while countries with lower scores (authoritarian governments) show a significantly higher propensity to politically agree with China and with the other BRICS countries.
The variable 'BRICS_Trade', which represents trade with BRICS countries as proportion of total trade, demonstrates a significant positive correlation with the probability of governments to share common preferences at the UNGA with both China and BRICS. An increase in trade with BRICS nations corresponds to a higher probability of governments to share common policy preferences with China and with the bloc. Conversely, diminished trade with BRICS countries is linked to a greater propensity of governments to politically align with the USA. This underscores the influential role ofthe BRICS bloc in shaping political preferences.
Countries with currencies anchored to the euro ('Euro_Anchor') show a significantly higher propensity to share common policy preferences with the euro area. On the other hand, nations with central banks anchoring to the US dollar ('USD_Anchor') demonstrate a significantly higher probability of having common political preferences with China and BRICS countries. The negative constant terms represent the baseline probability of a government aligning with the USA, EU, China, and BRICS, when all other factors are held constant. Essentially, they imply that without the influence of the variables in the models, the probability of alignment with any of these blocs would be close to zero.
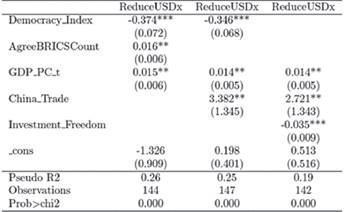
Table 9 Probit Models on Intention to Reduce US Dollar Use Without Sanctioned Countries, 2022
Note: *** stands for significant at 1%, ** at 5%, and * at 10%.
Source: Own estimations with The Economist Intelligence Unit, Heritage Foundation, Voeten (2013), and OEC Trade data.
Table 10 Probit Models on Intention to Reduce US Dollar Use Including Sanctioned Countries, 2022
Note: *** stands for significant at 1%, ** at 5%, and * at 10%.
Source: Own estimations with The Economist Intelligence Unit, Heritage Foundation, Voeten (2013), and OEC Trade data.
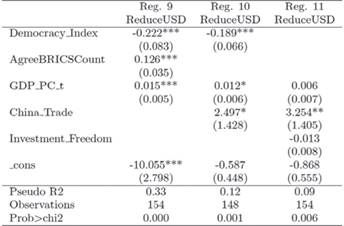
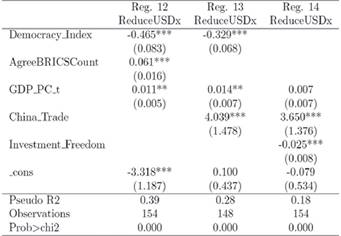
Tables 9 and 10 present the results of equation (2) models regarding governments' inclination towards de-dollarization and currency diversification initiatives, explained by 2022 variables data. Table 9 focuses on non-sanctioned governments, while Table 10 includes both non-sanctioned and sanctioned ones.
Both tables reveal a significant relation between authoritarianism and governments' intention to engage in de-dollarization initiatives. Table 9 indicates a significant propensity for governments with authoritarian traits (lower ‘Democracy_Index’ scores), excluding geographically targeted sanctioned countries, to agree on diversification measures. This relationship is even stronger in Table 10, which includes sanctioned governments, highlighting the significant impact of authoritarianism for governments to particípate in de-dollarization initiatives.
An increase on common votes at the UNGA with the BRICS nations (‘AgreeBRICSCount’) shows to have a significant positive relation on governments propensity to engage into de- dollarization and currency diversification initiatives, for both non-sanctioned and sanctioned countries. This underscores the significant political influence of BRICS for countries to participate in diversification efforts.
A higher trade proportion with China (‘China_Trade’) shows a significant positive relation with governments intention to participate on de-dollarization agreements. Sanctioned countries also show to have a significantly higher trade reliance with China.
Capital controls index (‘Investment_Freedom’) relation is not strong enough on the sample which does not include sanctioned countries (Table 9). However, it shows to have a significant relation on Table 10, including sanctioned governments, which reinforces the link between capital controls and authoritarianism. Thus, an increase in capital controls (lower index levels) increases the likelihood ofgovernments to engage in de-dollarization measures.
The control variable ‘GDP_PC_t’, or per capita GDP at current prices (USD thousands) displays a small, but positive, and significant relation for governments to engage in de- dollarization initiatives. This relation is explained by some emerging markets that are also prone to engage in diversification agreements, as was discussed in previous sections. The negative and close-to-zero intercepts on both tables underscore the expected value of the outcome variable, highlighting the significance of the included variables in shaping countries’ stances on de-dollarization. Without the influence of the variables in the models, the probability of engaging into de-dollarization measures would be close to zero.
Table 10 evidence the same significant relations as Table 9, with higher pseudo R-squared values, explained by the stronger authoritarian traits on geographically sanctioned States, which also show stronger capital controls and greater reliance on China as a trade partner. All relations hold significantly true for 2021 data models (estimations shown in appendix).
As stated before, due to inertia, even if the intention exists, it will not be an easy task for authoritarian governments to just diminish the use of the US dollar, as agents still demand it. Nevertheless, with the decline of the political influence of the West, and its distancing from countries that do not seem to share the same development vision, diversification agreements may increase in the future and commodities may continue to be traded in other currencies besides the US dollar and euro.
Authoritarian governments show the willingness to increasingly accept non-traditional currencies, and successful measures within a significant coalition may still reduce the US dollar use in settlements between them, potentially influencing other developing economies that do not necessarily have authoritarian governments. Non-traditional reserve currencies, such as the Chinese renminbi, are far from achieving the same global relevance as the US dollar, but the currency’s growing use in international payments is positioning it as a diversification alternative for smaller economies, and there is an increasing ren for diversification of reserve currencies.
4. Conclusions
In summary, the empirical analysis evidences a significant relation between the governments' degree of authoritarianism and their propensity to engage in agreements to support de-dollarization initiatives. The probit models show that, currently, governments with authoritarian traits are more likely, not only to have common international policy preferences with the BRICS and China, but also to agree on accepting payments in alternative currencies. In contrast, the models, and correlations evidence that these countries still maintain a high dependence on the US dollar. The intention to diversify is also associated with some common features, like increasing capital controls, and trade with China.
These relations help to guide the discussion forward, as authoritarian traits are shown to have important implications for the international monetary system. A purely economic analysis reflects that, although there is an intention to de-dollarize, these efforts have had limited impact over the international dominance of the US dollar. However, recent agreements such as Indias with the United Arab Emirates to trade oil and commodities in rupees, or Russian renminbi settlements with Iran and China, cannot go unnoticed as important steps towards the international use of non-traditional reserve currencies. China's efforts to internationalize its currency have also led it to be the fourth most traded currency through SWIFT messaging, without considering what is traded exclusively through CIPS. On this matter, the political risk associated with sanctions has also played a role in its increasing use. Even if foreign investors have lately shown negative expectations about the Chinese stock markets19, it is most likely that the BRICS de-dollarization political project will continue its course and the number of commodity contracts in alternative currencies during 2024 may increase as well.
It is important to recall that the Bretton Woods agreement was overall, an agreement. After the war, the United States was the only issuer with sufficient stability to be able to provide a globally accepted means of payment and store of value. When the euro emerged at the end of 20th century, it seemed a viable alternative for developing economies and virtually the only serious competitor to the US dollar. It failed to achieve farther expansion due to the difficulties of enduring a monetary union, such as not being able to share risk-free assets and the impossibility of adequately coordinating economic policies between a heterogeneous group of economies (Ilzetzki, et al. 2020). However, despite not having shown the expected resilience to the financial crisis, the euro area has maintained its political proximity, and this can be an important lesson for future diversification projects.
At this moment, the most plausible BRICS strategy is to keep promoting trade and investment in their domestic currencies. A project to consolidate a single currency remains an unrealistic idea, but perhaps a reference currency like the European Currency Unit, prior to the creation of the euro, could be a mid-term plan. The dominance of the US dollar remains evident for the moment, but, as economies grow there are also new development poles. A significant fraction of countries no longer shows the same approval for the development vision of the US, and the data shows that developing economies and authoritarian States are politically misaligned with the West.
Claiming that the US dollar's dominance is explained only due to market forces might be a biased statement, as World War II played a big role in its internationalization. After the Cold War, the Western development model prevailed over the distorted economy of the Soviet Union, but nowadays, the shape of authoritarian governments seems to be different. Even if authoritarian governments fail to diversify payments in the short or medium term, it looks that the political project ofde-dollarization will remain as long as there are governments ideologically opposed to the United States. This is where the importance of authoritarianism lies, since, in such countries, conventional economic policy may stay in second place. As stated before, even with very low currency reserves or mostly gold reserves, authoritarian regimes can increase capital controls and exercise force if agents show discontent. On this matter, the “multipolarity” that is repeatedly mentioned at BRICS meetings may indicate a coalition expanding influence to some authoritarian allies, with aspirations ofeconomic independence from Western currencies. It remains to be seen what will happen during 2024, since several elections will take place in States that are still democratic and it is likely that non-democratic regimes will continue, due to the limited effect ofWestern sanctions and an ineffective foreign policy to approach development economies.