


Servicios Personalizados
Revista
Articulo
 Inglés (pdf)
 Articulo en XML
 Referencias del artículo
 Enviar articulo por email
Indicadores
-
 Citado por SciELO
 -
 Accesos
Links relacionados
-
 Similares en
SciELO
Similares en
SciELO
Compartir

 Permalink
Revista Boliviana de Física
versión On-line ISSN 1562-3823
Revista Boliviana de Física vol.42 no.42 La Paz nov. 2023
https://doi.org/10.53287/vokv3616om54g
A.ARTÍCULOS
Bolivian/U.S student atmospheric
field campaign in the bolivian andes
Campaña de mediciones atmosféricas
en Los Andes bolivianos realizada por
equipo estudiantil boliviano-estadounidense
David N. Whiteman1,2![]() , Marcos Andrade2,4
, Marcos Andrade2,4![]() , Ricardo Forno2
, Ricardo Forno2![]() , Rubén Mamani-Paco2
, Rubén Mamani-Paco2
Isabel Moreno2,Fernando Velarde2, Luis Blacutt2![]() , Rene Gutiérrez2
, Rene Gutiérrez2![]()
Fabricio Ávila2, Mónica Pozadas2, Decker Guzmán2![]() , Richard Peltier3
, Richard Peltier3
Adrián Acarapi2, Ayomiposi Ajayi4, Valeria Burgoa2, Alan Callaú2
Yahuar Benjamín Chambi2, Franco García2, Samantha Lobatón2, Hadijat Oke4
Fisayo Okunuga5,Belén Peñaloza2, Marco Antonio Rivera2, Monique Watson6
Shayla Reíd7, Hoven Zou7
1 Howard University, Washington, DC USA
2 Universidad Mayor de San Andrés, La Paz, Bolivia
3 University of Massachusetts, Amherst, MA USA
4 University of Maryland, College Park, MD USA
5 Illinois Institute of Technology, Chicago, IL USA
6 Purdue University, West Lafayette, IN USA
7 Eleanor Roosevelt High School, Greenbelt, MD USA
Recibido: 25 de septiembre de 2023 Aceptado: 24 de noviembre de 2023
Abstract
A student-focused field measurement campaign was held in the vicinity of Mt. Chacaltaya in the Bolivian Andes near the city of La Paz on May 24, 2022. The campaign was part of a program funded by the US Department of State, the main goal of which was to foster cultural and scientific exchange among Bolivian and US students. As part of this exchange, a group of eight Bolivian and four U.S. students worked together to plan and execute measurements which focused on quantifying the flow of particulate matter from the city of La Paz toward the summit of Mt. Chacaltaya, where the world's highest elevation Global Atmosphere Watch site is located. Measurements were performed at three locations along a canyon that leads toward the summit of Mt. Chacaltaya and is a natural pathway for city-generated pollutants to travel toward the GAW station. The measurements indicated the presence of regular, solar-heating-generated, downslope/upslope wind flow that aids the movement of particles near the mountain surface. The development of convection during the afternoon regularly decrea-sed the concentrations measured at the surface and thus complicated the interpretation of particle flows. A novel, low-cost tethersonde apparatus was developed by members of the Laboratory for Atmospheric Physics (LFA) at the Universidad Mayor de San Andrés (UM-SA). Use of this tethersonde permitted vertical profiles of winds, temperature, pressure and relative humidity to be acquired thus allowing the investigation of the vertical structure of the transition between downslope and upslope flow. Outside of the measurement campaign, the students engaged in cultural activities together to enjoy local Bolivian sites and get to know each other better. One of the goals of the experiment was to increase interest in the atmospheric sciences among UMSA students. The results of a post-campaign survey indicate that participation in this joint field campaign has increased the number of physics students participating in the activities of the LFA at UMSA.
Subject headings: Student training - transport of atmospheric pollution - mountain meteo-rology - black carbón and glaciers
Resumen
Una campaña de campo para realizar mediciones atmosféricas, centrada en el trabajo de estudiantes tanto bolivianos como estadounidenses, se llevó a cabo el 24 de mayo de 2022. La campaña fue parte de un programa financiado por el Departamento de Estado de EE. UU, cuyo objetivo principal fue fomentar el intercambio cultural y científico entre estudiantes bolivianos y estadounidenses. Como parte de este intercambio, un grupo de ocho estudiantes bolivianos y cuatro estadounidenses trabajaron juntos para planificar y ejecutar mediciones enfocadas en cuantificar el flujo de material particulado desde la ciudad de La Paz hacia la cumbre del monte Chacaltaya, donde se encuentra la estación más alta del mundo de la red Global Atmosphere Watch. Las mediciones se realizaron en tres lugares a lo largo de un cañón que conduce hacia la cima del monte Chacaltaya y es una vía natural para que los contaminantes generados por la ciudad viajen hacia la estación. Las mediciones indicaron la presencia de un flujo de viento ascendente y descendente, generado por el calentamiento y enfriamiento producido por radiación solar o la falta de ésta, que ayuda al movimiento de aerosoles cerca de la superficie de la montaña. El desarrollo de procesos convectivos durante la tarde disminuyó regularmente las concentraciones medidas en la superficie y complicó así la interpretación de los flujos de partículas. Miembros del Laboratorio de Física Atmosférica (LFA) de la Universidad Mayor de San Andrés (UMSA) desarrollaron un novedoso sistema de sondas cautivas de bajo costo. El uso de estas sondas posibilitó adquirir perfiles verticales de vientos, temperatura, presión y humedad relativa, permitiendo así la investigación de la estructura vertical de la transición entre el flujo ascendente y descendente. Fuera de la campaña de medición, los estudiantes participaron juntos en actividades culturales para disfrutar atracciones locales y conocerse mejor. Uno de los objetivos del experimento era aumentar el interés por las ciencias atmosféricas entre los estudiantes de la UMSA. Los resultados de una encuesta posterior a la campaña indican que la participación en esta campaña de campo conjunta ha aumentado el número de estudiantes de física que participan en las actividades del LFA en la UMSA.
Palabras clave: Entrenamiento de estudiantes - transporte de contaminación atmosférica -meteorología de montaña - carbono negro y glaciares
1 Introduction
The health of Andean snow pack and glaciers has long been a concern due to their importance as sources of freshwater and the observed accelerated melting due to climate change and pollution ( Francou et al., [2003], Soruco et al., [2009], Vuille et al., [2018], de Magalhães et al., [2019]). Mt. Chacaltaya (16.347° S, 68.128° W, 5.4 km) in the Bolivian Andes is located only ˜22 km from the center of La Paz city making it an excellent site for studying these effects. In 2011, the world’s highest elevation Global Atmosphere Watch station (CHC) was established ˜200 m below the summit of Mt Chacaltaya at an elevation of 5.24 km. Instruments located at the site monitor atmospheric composition in this highly populated, but under sampled ( Laj et al., [2020]), region. Measurements from the GAW station and the conurbation of La Paz/El Alto have been used to conclude that automobile-generated pollutants regularly are transported to the GAW station thus significantly impacting its environment ( Wiedensohler et al., [2018]). An intensive measurement campaign staged over a 6-month period from late 2017 into mid 2018 indicated that certain transported pollutants can change in composition during their transit from source point to the GAW station ( Bianchi et al., [2021]).
All of these studies point in various ways to the importance of aerosol transport in understanding the particle environment of the CHC GAW station. Yet, potential mechanisms of this transport have not been directly studied. The focus of the experimental work here was to involve a group of Bolivian and U.S. students in the design and execution of a field measurement campaign, the goal of which was to attempt to directly measure this aerosol transport mechanism and its effects. While just a single day was devoted to the measurements, which were made primarily using low cost sensors, the overall experience of planning and executing the campaign provided excellent training for the young scientists involved.
These efforts were funded by the USA StudyAbroad program of the U.S. Department of State and included cultural exchange components in addition to the scientific efforts that are the focus of this paper. For example, all scientific communications were conducted in English to help prepare the Bolivian students for participation in the international scientific community, where English is the common language. U.S. students were exposed to a great variety of Bolivian life and culture by being housed by Bolivian families during their time in La Paz and by taking joint excursions with the Bolivian students both in La Paz/El Alto and to surrounding areas such as Corioco, where they visited a wildlife preserve, and Lake Titicaca, where they learned about the history of reed boat construction at the lake. These experiences have strengthened the students’ understanding of different cultures and exposed them to research opportunities in a unique Andean environment with a secondary goal of increasing participation in atmospheric sciences and, in particular, in the activities of the Laboratory for Atmospheric Physics at UMSA.
2 Methods and Procedures
The mechanism referred to as mountain ducting or the Mountain Chimney Effect (MCE) ( Lu & Turco, [1995], Whiteman et al., [2023], Whiteman, [2000], Pal et al., [2017]) was taken as the starting point for the design of the experiment. The MCE is driven by solar heating which creates upslope winds that move particles toward higher elevation following natural pathways such as canyons and river beds.
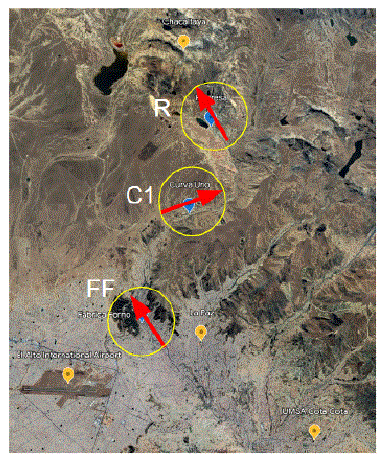
Fig. 1.— Experimental locations of Fabrica Forno (FF), Curva Uno (C1) and Represa (R) along a canyon leading up to Mt. Chacaltaya with the upslope directions noted by red arrows. In yellow markers from the top are also shown the locations of the GAWstation at Chacaltaya, the center of La Paz, El Alto airport, and the UMSA campus in Cota Cota to the SE of the city center.
We hypothesized that solar heating on the slopes leading up to the CHC GAW station creates a region of heated, less dense air that tends to flow uphill. This phenomenon is typically extends tens of meters vertically ( Whiteman, [2000]). The reverse happens over night when colder, denser air flows downhill toward lower elevations. If this mechanism is present, one would expect that the overnight downslope flow would reverse sometime after sunrise to become an upslope flow after sufficient heating of the surface had occurred. One also might expect that this flow reversal would influence the particulate matter (PM) and equivalent black carbon (eBC) measurements acquired at the three sites with upslope flow tending to “pull” more pollution-laden air from the lower-lying city of La Paz, whereas downslope flows would tend to transport cleaner air from higher elevations.
3 Measurement Locations
Three locations, shown in Figure 1 and described in Table 1, were chosen along a canyon leading from La Paz toward Mt. Chacaltaya for measuring pollutants and winds. There was an expectation that if recurring patterns were found in these fields one might be able to infer the movement of pollutants upward from one station to the next and ultimately to the CHC GAW station. We selected Tuesday May 24, 2022 as the day to perform the measurements with the following day as backup if needed. Due to complications in the measurements at the Represa site, where we believe the existence of multiple canyons caused the wind field to be highly variable, in the following analysis we present examples only from the Fabrica Forno and Curva Uno locations.
4 Instrumentation
As shown in Table 1, each location was instrumented such that temperature, pressure, RH and winds could be monitored both at the surface and in the profile above each site. Particulate matter (PM) and equivalent black carbon (eBC) were measured at the surface only. We detail the instruments used below.
4.1 Tethersonde
Repeated vertical profiles of winds were desired at each of the measurement sites in order to better understand the local upslope and downslope wind characteristics and, hopefully, to capture the transition from the anticipated overnight downslope wind to the daytime upslope wind. The original intention was to make use of the home-built tethersonde systems used previously in student experiments in both Bolivia and the U.S. ( Whiteman et al., [2023]) but these systems were powered by a hand-drill that required AC power. No power was available at the measurement sites so a solution was needed that required little or no battery power. Furthermore, a tethered balloon cannot accurately measure winds due to the restraint of the string that prevents the balloon from ascending freely. Therefore, a novel tethersonde solution was needed that required no power and would permit the balloon to ascend freely but still be recoverable. Initially, that seemed an insurmountable challenge. However, Lic. Ricardo Forno and members of the LFA staff devised an ingenious solution that proved capable of providing all the required measurements.
Table 1: The coordinates, elevations and the upslope and downslope wind directions, estimated from local topography, and instrumentation are given for each of the experimental locations : Fabrica Forno, Curva Uno and Represa.
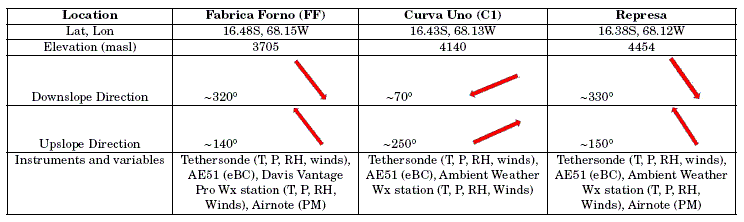

Fig. 2: Manual tethersonde solution that required no power, permitted the balloon to fly freely on ascent thus permitting accurate wind measurements and was recoverable. The balloon at its highest ascent is shown in the upper right with the first water bottle lifted off the surface. The line of bottles ready to be lifted is shown in the main photo. Repeated profiles were successfully performed at all three experimental locations with these devices.
This device is illustrated in Figure 2 as it was used at the Curva Uno site on the measurement day of May 24, 2022. The device consists of a 150 g balloon and standard radiosonde that are attached to an approximately 200m length of high strength, low weight fishing line. Attached to the bottom of this fishing line is a series of partially-water-filled 500 mL soda bottles that are lifted off the ground as the balloon nears its maximum height. As the balloon lifts successively more bottles, its ascent is stopped gradually and the balloon can then be retrieved by manually pulling the string back down. A standard Intermet Systems iMet1 radiosonde was attached to the balloon and provided measurements of temperature, pressure, RH and winds as a function of altitude. The iMet data were recorded in real-time on a battery-powered laptop running NOAA Skysonde software, which received the iMet data using a battery-powered iCom Rx-7 handheld radio tuned to the 403 MHz signal of the radiosonde. Example profile measurements can be seen later in Figure 7.
4.2 Low-cost particulate matter sensors
The particulate matter measurements presented here were made by a device that is manufactured by Blues Wireless and is called the Airnote. It consists of a cellular modem, a low-cost PM sensor (Plantower PMS7003) and uses a solar panel rechargeable battery. The device is set to “wake up” every 15 minutes and acquire PM measurements. The temporal resolution of the resulting data is therefore 15 minutes. Studies ( Badura et al., [2018]) have indicated that this sensor has excellent precision although errors can be significant when measuring small PM amounts, which is consistent with the manufacturer’s stated accuracy of +/- 10 µg/m3 for measurements in the range of 0-100 µg/m3. It was also found that elevated relative humidity (RH) can cause spuriously large readings similar to results obtained using earlier versions of Plantower PM sensors ( Zheng et al., [2018], Whiteman et al., [2023]).
4.3 Aethalometer
The AethLabs AE51 is a pocket sized, fixed-filter aethalometer that determines equivalent black carbon concentration (µg/m3) in real-time with temporal resolution of 1 minute. Due to its small size and ability to operate for > 20 hours using battery power, the AE51 has been used in a number of personal exposure studies (e.g. Bista et al., [2022]). Performance studies have indicated excellent repeatability although there is a tendency for measurements to be biased low as PM accumulates on the filter although there are correction techniques for this effect ( Good et al., [2017], Lee, [2019]). Three AE51s were used in this study, one at each of the measurement locations shown in Figure 1.
4.4 Weather stations
Weather stations providing surface measurements of temperature, pressure, RH and winds manufactured by Davis Instruments and Ambient Weather were used in this experiment. A Davis Vantage Pro2 was installed at the Fabrica Forno site while Ambient Weather WS-5000 units were installed at both the Curva Uno and Represa sites.
4.5 WRF simulations
Weather Research Forecasting simulations were performed by members of the Laboratory for Atmospheric Physics to aid preparations for the measurement campaign of May 24, 2022. Four nested domains were used ranging from 27 km spacing for the outermost grid to 1 km spacing for the innermost, which tightly surrounded the region of the three measurement sites of Fabrica Forno, Curva Uno and Represa. Hourly simulations performed 36 hours in advance of the campaign indicated that a transition from downslope to upslope flow near the surface would occur during the campaign and extend across much of the measurement domain. Figure 3 shows the 2 m wind forecast at 0300 (left) and 1200 (right) local time. The 0300 low-level wind forecast shown on the left indicated that downslope winds at both the Fabrica Forno (red square) and Represa (red triangle) sites while the winds at Curva Uno (red circle) would be easterly. The forecast at 1200 local time is shown on the right and indicates predominantly upslope flows across the domain.
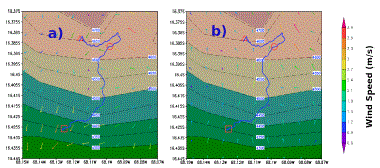
Fig. 3: Weather Research Forecast simulations of the wind field at 2 m above the surface on May 24, 2022. The forecasts for 0300 and 1200 local are shown Figs 3a and 3b, respectively. Wind speed in m/s of the colored wind bars is shown in the color bar on the right. Elevation in masl is shown via inset boxes ranging from less than 4300 m to above 4700 m. In general, the forecast indicated a downslope flow dominated the measurement region over night and was replaced by upslope flow during the daytime.
5 Measurement protocols
Bolivian and US students and mentors were pided into three different research groups; one group each for the three measurement sites. On Monday May 23, 2022 all groups participated in a training session at the UMSA Cota Cota campus in the southeast part of La Paz and practiced balloon inflation and operation of the various instruments. Before sunrise on the next day of May 24, 2022 the three groups assembled separately and packed up three vehicles to transport all apparatus to the measurement sites of Fabrica Forno, Curva Uno and Represa. The goal was to commence measurements, including tethersonde ascents and descents, prior to sunrise and thus also prior to the anticipated transition between downslope and upslope flows. Because of logistical delays and heavy traffic, however, teams arrived at their sites later than anticipated. Another item that caused delays in the start of tethersonde measurements was the fact that a single helium bottle was being shared among the three sites. The time required to set up instruments and start their operations and inflate balloons pushed the start of actual tethersonde data collection at the different sites to between approximately 0900 and 1000 local time. As will be discussed later, due to these delays it was only at the Curva Uno site that the transition between downslope and upslope flows was observed in the tethersonde measurements.
6 Results and Discussion of data
Early in the morning of May 24, 2022, the three groups assemble and traveled to the measurement sites shown in Fig 1. Tethersonde, aethalometer and PM instruments were installed at all locations.
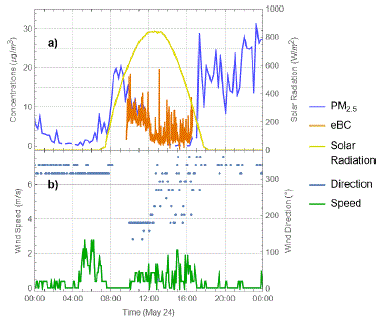
Fig. 4: Measurements acquired from the rooftop of the Fabrica Forno site. In the upper plot are shown the time series of particle concentrations and solar radiation for May 24. In the bottom plot are shown wind speed and direction. The solar radiation measurements were acquired from a site located 2 km from Fabrica Forno. PM and eBC measurements have been converted to standard temperature and pressure conditions.
Instruments measuring winds and PM had been installed on the rooftop at the Fabrica Forno location several weeks earlier which permitted studies of the evolution of these parameters over more extended periods. Figure 4a presents equivalent black carbon measurements (µg/m3) made at Fabrica Forno using the AethLabs AE51 aethalometer from approximately 0900 to 1700 local time (shown in orange). Also shown in the figure is the 24-hour record of PM2.5 measured by the Airnote. As an indication of solar conditions, the solar radiation measured from a location 2 km away from Fabrica Forno is also shown. Figure 4b gives the 24-hour record of wind speed and direction. Table 1 shows that the directions of upslope and downslope wind at Fabrica Forno, determined from local topography and assuming that low-level wind flow would follow the local canyons, were estimated to be 140° and 320°, respectively. Referring again to Figure 4b, between midnight and approximately 0800 local time the wind direction varied between 320° and 340°, which is consistent with the presence of downslope flows. Between approximately 0800 and 0900, winds were calm, thus no direction could be specified. Between 0930 and 1230, surface winds were primarily from 180° with some occasional variation to 140°, roughly consistent with the upslope flow direction estimated in Table 1. After 1230, the wind direction became highly variable between 180° and 360°. These variations in flow direction can be understood better by reference to the solar radiation measurements shown in Figure 4a.
May 24 was a mostly clear day in the La Paz region. The solar radiation curve shown in yellow in Figure 4a indicates a smooth increase of incident radiation starting at sunrise at ˜0730 to a peak of approximately 825 W/m2 at 1230. From midnight until sunrise, downslope flows became increasingly well developed with a nearly constant wind direction and with wind speeds reaching a maximum of ∼3 m/s approximately 2 hours before sunrise. The increase in surface heating due to the rising sun created the conditions for the MCE to develop which caused a reversal in the wind direction by approximately 0930. After this time, surface wind speeds increased to approximately 2 m/s. The large variability in wind direction observed between 0930 and 1230 is interpreted as being due to the turbulence associated with the development of convective activity in the afternoon. It is interesting to now consider the variation in PM concentrations in light of the wind variations just described.
Figure 4a shows that PM2.5 measurements from Fabrica Forno were generally much less than 5 µg/m3 between 0000 and 0800. During this time the dominant wind direction shown in Figure 4b was 320° – 340° which is consistent with a downslope flow. A significant increase in PM2.5 was observed after 0800 which could be due to morning vehicular traffic. The onset of upslope flow at 0930, denoted by a change in wind direction to ∼140°-180°, caused a decrease in PM concentrations which were further decreased after 1230 when a variable wind pattern developed. These variable winds are consistent with the development of convection which can cause an increase in the height of the planetary boundary layer (PBL). An increased PBL height provides more volume into which PM can be mixed which can explain the low surface PM concentrations that are observed between 1230 and 1630. PM concentrations increased as the sun was setting and remained at elevated levels even as the downslope winds resumed after ∼1900. These elevated PM values could be due to dust and pollutants caused by evening traffic or could be due to dust that was lifted from the surface during the afternoon convection that had not yet settled down.
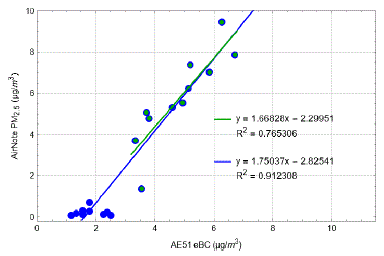
Fig. 5: Comparison of PM2.5 measured by the Airnote instrument and equivalent black carbon measured by the AE51 aethalometer at Fabrica Forno. Two methods of processing the data are shown.
It is interesting now to compare PM2.5, measured by the low-cost Airnote sensor (the Plantower device inside the Airnote costs ∼$20-30), and equivalent black carbon measured by the considerably more expensive AE51 (∼$5-6k) given that black carbon forms a part of the total particulate matter budget. We will assume that during the time of the measurements the composition of the PM2.5 sampled was fixed and that a linear regression of the two measurements is therefore appropriate. Linear regressions are shown in Figure 5 performed in two ways. The first, with a blue color scheme, uses all available points after the 1-minute resolution eBC measurements were averaged to the 15 minute intervals of the PM2.5 measurements. The second technique, shown in a green color scheme, filters out the PM2.5 measurements below 1.0 µg/m3 prior to performing the regression. The manufacterer’s uncertainty specification that was noted previously indicates that the absolute uncertainty of the measurements increases with decreasing PM2.5 amount. We take this to be the explanation for the apparent lack of sensitivity of the Airnote to PM2.5 concentrations below ∼1.0 µg/m3. The PM values below 1.0 µg/m3 were therefore filtered out in the second regression shown.
The two regressions give similar slopes (1.69, 1.75) and intercepts (-2.3 µg/m3, -2.8 µg/m3) although the tight packing of the PM2.5 values below 1.0 µg/m3 causes the second regression to show a higher correlation as evidenced by the R2 values of 0.91 versus 0.76. The non-zero intercepts complicate interpretation but based on the regression slopes alone, which indicate the increase in PM2.5 per unit increase in eBC, we infer that black carbon concentrations were approximately 58% as large as PM2.5 concentrations during the measurement period.

Fig. 6: Weekly average PM2.5 (top) and wind speed and direction (bottom) at Fabrica Forno for the weeks starting May 22, May 29, June 26, July 3, July 10, and July 24. PM2.5 concentrations have been converted to standard temperature and pressure conditions.
Extended measurements of winds and PM were available at the Fabrica Forno site. Studying those measurements can help to understand the meteorological context of the May 24 measurements just described. Figure 6 presents the weekly average values of wind speed, wind direction and PM2.5 concentration using 6 weeks of data during the May-July, 2022 period. Grey banding has been used to indicate the nighttime periods. All weeks chosen for analysis were characterized by a complete data set and generally sunny skies with at most a small amount of high-altitude cloud cover as evidenced by solar radiation measurements made near to Fabrica Forno, an example of which is shown in Figure 4. Also, the week of June 21 was avoided due to the occurrence of the San Juan events on the 23rd when a large number of fires are set in and around La Paz. Such fires create very high values of PM and eBC which would skew the average from the more usual dry season conditions that were sought for these measurements.
The first point to make concerning Figure 6 is the evident diurnal periodicity in all of the measurements. The average values of PM2.5 have several recurring features. In general, there is a significant increase in PM values as sunrise approaches. The middle of the day is generally characterized by a decrease in PM2.5 while the approach of the evening causes the PM2.5 values to again increase. These same patterns were observed on May 24 as shown in Figure 4 and are similar to earlier results previously noted ( Wiedensohler et al., [2018]). Figure 6 indicates that those patterns were generally prevalent at Fabrica Forno during the six weeks of measurements that occurred in the Bolivian dry season. Considering now the wind measurements, we can see another definite periodicity in both the wind speed and wind direction. The wind direction shows diurnal variation that is consistent with the daily development of downslope and upslope winds. Upslope winds tend to develop ∼2 hours after sunrise while the reversal to downslope winds occurs approximately at sunset. The average value of the wind direction during the downslope period is approximately 300°-320°, while the mean downslope values vary between 180°-210°. The downslope directions that developed at the end of the day and persisted overnight were less variable in direction than the upslope directions that were present during the day. As in Figure 4, the daytime upslope directions shown in Figure 6 could be highly variable which caused the mean value of upslope winds to agree only approximately with the estimates of upslope direction given in Table 1. The most important conclusion to note from the mean direction values is that the development of upslope and downslope flows was a common occurrence during the measurement period. The wind speed variation is also diurnal with mean winds speeds of ∼1-2 m/s during the daytime when upslope flows and convection have developed. The speeds of the downslope winds that occur over night are generally lower with mean values ranging between 0.2 – 0.8 m/s. Given that the measurements analyzed in Figure 6 covered approximately half of the dry season period, we take the PM and wind variation shown in Figure 6 to likely be indicative of the entire dry season period.

Fig. 7: Vertical profiles of wind speed and direction acquired at the Curva Uno site using the novel tethersonde device. The red arrows indicate the directions of upslope and downslope flows estimated from the local topography.
All of the analysis thus far has been with surface-based measurements acquired at the Fabrica Forno site. We turn attention now to Figure 7 which presents the vertical profile of wind speed and wind direction measurements at the Curva Uno site using the novel tethersonde apparatus shown in Figure 2. Measurements from Curva Uno are shown since, at the Fabrica Forno and Represa sites, the tethersonde measurements were not started early enough in the morning to capture the transition between downslope and upslope winds.
Figure 7 presents the first four ascents measured at Curva Uno which are stacked one on top of the other. As indicated in the figure, the ascents occurred between the local times of 0910-0912, 0923-0925, 0938-0939, 0948-0949. These times indicate that it took approximately two minutes for the balloon to ascend to its maximum altitude of ∼150m. Manually pulling the balloon down and preparing for the next ascent took ∼10-13 minutes.
As a visual aid to interpreting the vertical profiles, two red arrows are shown overlaid on the figure corresponding to the mean downslope (70°) and upslope (250°) directions estimated from the local topography and shown in Table 1. Figure 7 shows that during the first tethersonde balloon ascent that occurred at 0910-0912, the vertical wind profile was characterized by a generally downslope flow between the surface at 4.14 km up to an altitude of 4.25 km. Above this altitude the flow tends toward downslope in nature with wind directions increasing to more than 200°. Note also that during the downslope portion of the profile wind speeds peak between 3-4 m/s while, as the winds are turning toward a value of ∼200° above 4.25 km, the wind speed decreases to ∼1 m/s. The second ascent occurred at 0923-0925 and appears to show an intermingling of downslope and upslope flows. This is evidenced by wind directions which vary rapidly between roughly downslope flows of 50°-100° (between altitudes of 4.14-4.19 km, 4.22-4.26 km, 4.27-4.29 km) and upslope flows of ∼300° (e.g. 4.19-4.22 km, 4.26 km, 4.29 km). Note that during these intermingled flows, when the winds are reversing at varying altitudes, speeds are generally reduced to between 0.5 – 2.0 m/s although at the centers of the intermingled flows, e.g at altitudes of ∼;4.18, 4.20, 4.23, 4.28 km, there are small wind speed maxima supporting their interpretation as intermingled flows. By the time of the third ascent at 9:38-9:39, the vertical wind profile indicates that upslope flow was well established throughout the vertical profile and that wind speeds were 1-2 m/s. The fourth profile acquired 10 minutes later at 0948-0949 also shows an upslope profile but one that is more developed as evidenced by the higher wind speeds which peak above 4 m/s. The profiles shown in Figure 7 indicate that the reversal of flows on May 24, 2022 occurred non-uniformly in the vertical profile and, at least in the lower 150 m of the atmosphere, took approximately 20-30 minutes to complete. Note that we also analyzed the virtual potential temperature to study if there were different air masses involved in the upslope and downslope portions of the profile, particularly in the case of the second ascent which showed the intermingled upslope/downslope flows. We found no definite correlation between flow direction and virtual potential temperature, however.
7 Student Engagement
The U.S. students involved in this activity were all current or past students at Eleanor Roosevelt High School in Greenbelt, MD and had conducted their senior year research project under the mentorship of the lead author ( Whiteman et al., [2023]). The Bolivian students were selected based upon a competitive application that was circulated among UMSA physics students.
A primary goal of this student-focused field measurement campaign was to motivate students, particularly at UMSA, to continue studying atmospheric sciences. Following the field campaign activities, a survey was conducted among all the students to gauge the success of the week-long effort in accomplishing this goal with 9 of the 12 students responding. The results of the survey indicated that 90% or more of the students who responded significantly improved both their understanding of experimental atmospheric sciences and the influence of pollution transport on the high Andean environment. All students indicated that their interest in experimental atmospheric science was increased by this experience and that they are more likely to participate in future atmospheric sciences opportunities. All Bolivian students indicated that they would like to work with the Laboratory for Atmospheric Physics in the future.
The results of this survey indicate that the joint US Bolivian field campaign was very successful at increasing students’ insight into atmospheric sciences and in motivating them to continue working in the field. Several of the students who participated in this campaign are, in fact, now working with the LFA in laboratory activities.
8 Summary and Conclusions
A student-focused field campaign involving both Bolivian and US students was conducted successfully on May 24, 2022. The campaign was conducted as part of a larger effort funded by the US Department of State that focused on student cultural exchange. The student analysis of the data revealed regularly occurring diurnal patterns in the wind speed and direction at the Fabrica Forno site that are consistent with overnight downslope flows that transition to upslope flows during the daytime. The daytime period was also characterized by increased variability in the wind field which was taken to be an indication of convection. The concomitant increase in the planetary boundary layer height during the daytime regularly caused a significant decrease in surface measured PM values. As opposed to our hypothesis, we found that the presence of downslope flows after sunset did not necessarily bring cleaner air to our measurement sites. We took this to be due to the influence of more locally generated aerosols such as from automobiles and wind-blown dust.
Tethersonde measurements did not commence early enough at either the Fabrica Forno or Represa sites to permit the study of the transition between downslope and upslope flows. At the Curva Uno site, however, vertical wind profile measurements acquired using the tethersonde apparatus on May 24 indicated that this flow reversal was quantified. The initial data analysis also indicates that during the flow reversal period downslope and upslope flows likely intermingled as a function of altitude at Curva Uno for several minutes before an upslope flow was observed to dominate at all elevations up to ∼150 m agl. The transition between downslope and upslope flows was found to occur over a period of ∼20-30 minutes at the Curva Uno site.
The student field campaign experience was a very gratifying one both scientifically and culturally. The students worked together virtually both before and after the campaign and worked closely together during the week of May 24. There also was time for the students to enjoy the city of La Paz and its surrounding areas. A survey taken after the campaign indicated that all students gained in their appreciation of pollution flows in the Andes. Also, all Bolivian students indicated increased interest in working with the UMSA Laboratory for Atmospheric Physics in the future. In fact, several of the co-authors are now working as research assistants at the LFA indicating that a hands-on field measurement experience can motivate students to become more involved in atmospheric sciences.
ACKNOWLEDGMENTS
We gratefully acknowledge the support of the U.S. Department of State’s USAStudyAbroad program and the US Embassy/La Paz. In particular, we wish to thank Kathryn Holmgaard and Diego Ballivian of the US Embassy in La Paz for their support of this activity.
Conflicts of interest All authors declare that they have no conflicts of interest with respect to the publication of this document.
References
Badura, M., Batog, P., Drzeniecka-Osiadacz, A., & Modzel, P. 2018, Journal of Sensors, 2018 [ Links ]
Bianchi, F. et al. 2021, Bulletin of the American Meteorological Society, 103(2), 212 [ Links ]
Bista, S., Dureau, C., & Chaix, B. 2022, Environment International, 158, 106990 [ Links ]
de Magalhães, N., Evangelista, H., Condom, T., Rabatel, A., & Ginot, P. 2019, Scientific Reports, 9, 16914 [ Links ]
Francou, B., Vuille, M., Wagnon, P., Mendoza, J., & Sicart, J.-E. 2003, Journal of Geophysical Research: Atmospheres, 108(D5) [ Links ]
Good, N., Mölter, A., Peel, J., & Volckens, J. 2017, J. Expo. Sci. Environ Epidemiol, 27, 409 [ Links ]
Laj, P. et al. 2020, Atmos. Meas. Tech., 13(8), 4353 [ Links ]
Lee, J. 2019, Appl. Sci., 9(13), 2766 [ Links ]
Lu, R. & Turco, R. 1995, Basin. Atmos Env., 29, 1499 [ Links ]
Pal, S., Lee, T., & de Wekker, S. 2017, Atmos. Env., 164, 165 [ Links ]
Soruco, A., Vincent, C., Francou, B., & Gonzalez, J. F. 2009, Geophs. Res. Lettr., 36(3) [ Links ]
Vuille, M. et al. 2018, Earth-Sci. Rev., 176, 195 [ Links ]
Whiteman, C. D. 2000, Mountain Meteorology (Oxford University Press) [ Links ]
Whiteman, D. N. et al. 2023, Bulletin of the American Meteorological Society, 104(2), 504 [ Links ]
Wiedensohler, A. et al. 2018, Atmos. Environ., 194, 158 [ Links ]
Zheng, T. et al. 2018, Atmos. Meas. Tech., 11(8), 4823 [ Links ]

